data demystified #3: A Deep Dive Into the Distribution of Progressive Ideology

By: Kevin Reuning (@KevinReuning)
In our previous DFP blog, Anne Whitesell and I explored predicted levels of support using latent variables that we made with DFP’s “Polling the Left Agenda” survey. This is not the only way of examining the data generated with the latent model. We can also look at the general ideology of individuals from the survey as well as well how progressive or conservative an issue is.
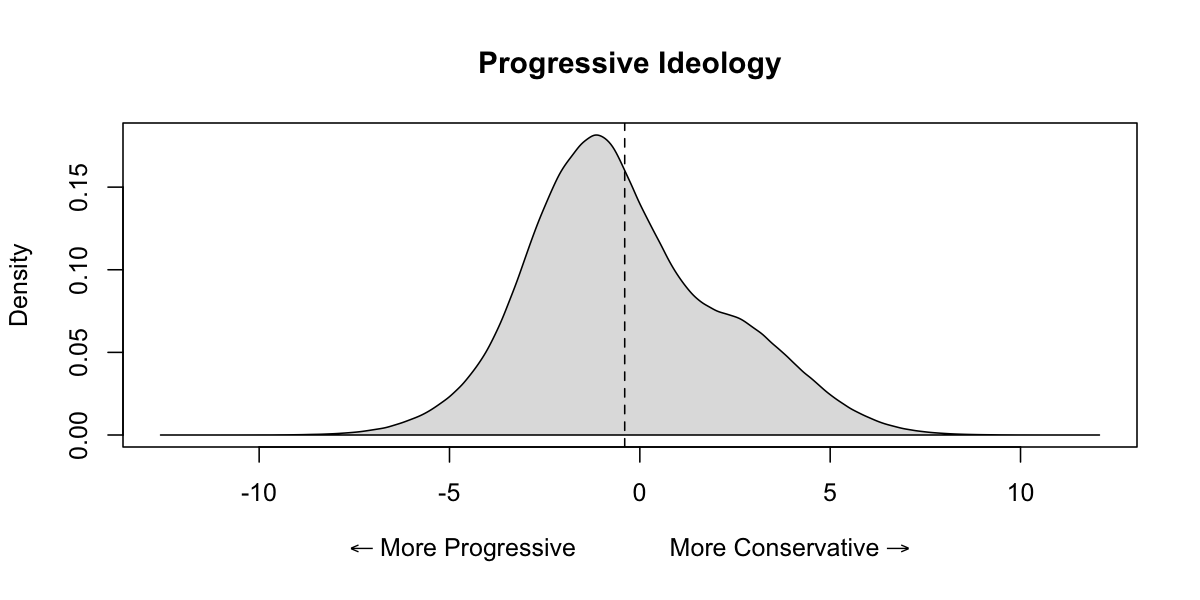
The simplest way to start is by looking at the ideological distribution of all respondents in the survey. This ideology is calculated as part of the latent variable model, and reflects where people sit on a left-right continuum. The distribution below is a kernel density plot for the estimated ideologies. It accounts for the error inherent in estimating an individual’s ideology by using the full distribution of each person’s ideology to calculate the overall distribution among survey participants.
By itself, this distribution is not that interesting. We see that ideology is generally normally distributed (which was assumed by the model). What is interesting is that there is a hump on the right (conservative) side. This is the biggest divergence from the normal distribution and indicates that there is a relatively large group of very conservative voters. This does not mean that there are more conservatives than progressives, just that the distribution of conservative ideology is skewed.
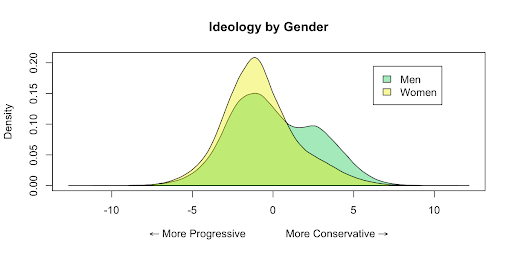
Again, by itself this is only so interesting, but we can use it to start looking at differences among groups. Below, I show the different distribution of estimated ideologies for men and women. We find what we would generally expect, that women tend to be more progressive than men. It also turns out that that hump of extra conservative respondents comes mainly from men. The distribution of ideology from women alone follows a normal distribution while the distribution of men is bimodal.
We can narrow things down even further and compare distributions between white and non-white men. Perhaps unsurprisingly for the DFP frequent flyers, it looks like the majority of bimodality comes from… white men. The difference in distributions maybe isn’t as extreme, but the bimodality of white men is pronounced.

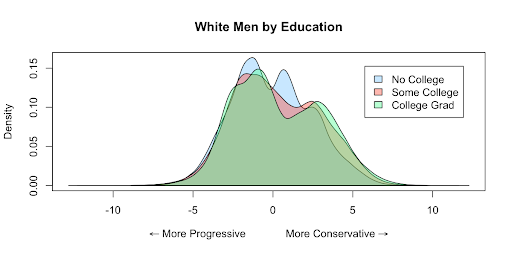
One more level provides additional illumination. Breaking down white men by education we see a new pattern emerge. All three sets are somewhat bimodal, but the placement of that second peak varies. White men with a college degree or postgraduate education have the furthest conservative second peak. In contrast, the second peak of those with no college degree is relatively more moderate. This shows that the most conservative group is not undereducated white working class men, but is instead comprised of highly-educated upper class white men. A large group of these upper class white men are radically conservative compared to the rest of the electorate. Even the more moderate among them tend to be more conservative than many other groups.
We can also explore changes across age. There is some hope here. The 65+ group of white men are by far the most conservative, and theirs is the only case where the conservative peak is the highest peak. As we move down by the age group we see this conservative peak shrink more and more, becoming closer to a normal distribution. Some of these subgroups are relatively small compared to the full sample, and so all of this should be taken with a grain of salt, but most of them still have an N of at least 200.

What does this mean for the issues?
All of this can seem abstract. We are talking about an ideological scale which we don’t directly observe. What we observe instead are responses to survey questions. It is possible though to examine how the ideological scale relates to the particular survey questions that were asked.
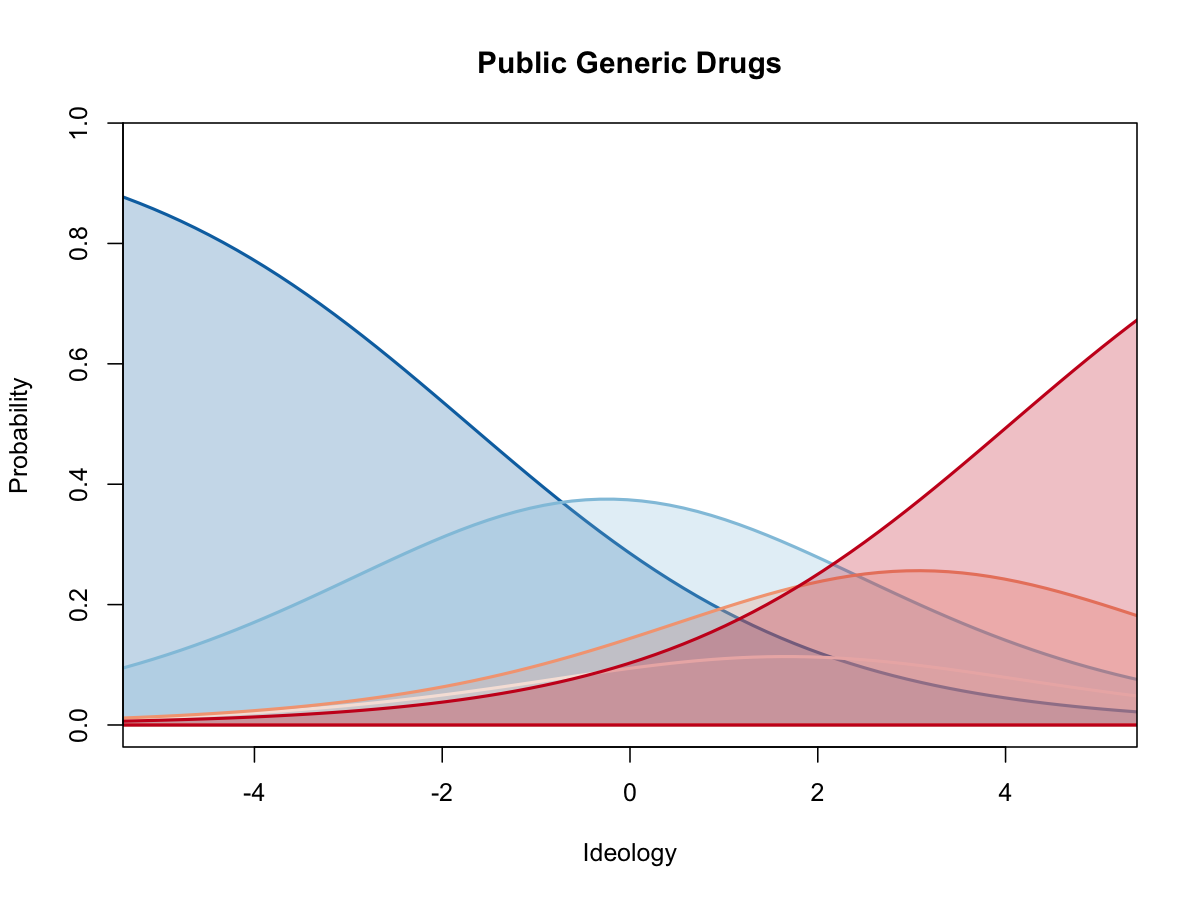
The plot shows the probability of each response across the range of ideology. The darkest blue is strongly agree (the progressive response), while the darkest red is strongly disagree (the conservative response). For public generic drugs, even those that are relatively moderate (at the 0 of the ideological scale) are likely to either approve or strongly approve of public generic drugs. Even those that are very conservative are (on the right side of the scale) have a 10 to 20 percent change of approving of public generic drugs.
Support for job guarantee has a somewhat similar pattern. Again, even moderate voters tend to approve of a job guarantee. Conservative voters are much more united in opposition to a job guarantee. It is very unlikely that anyone with a conservative viewpoint would support it.

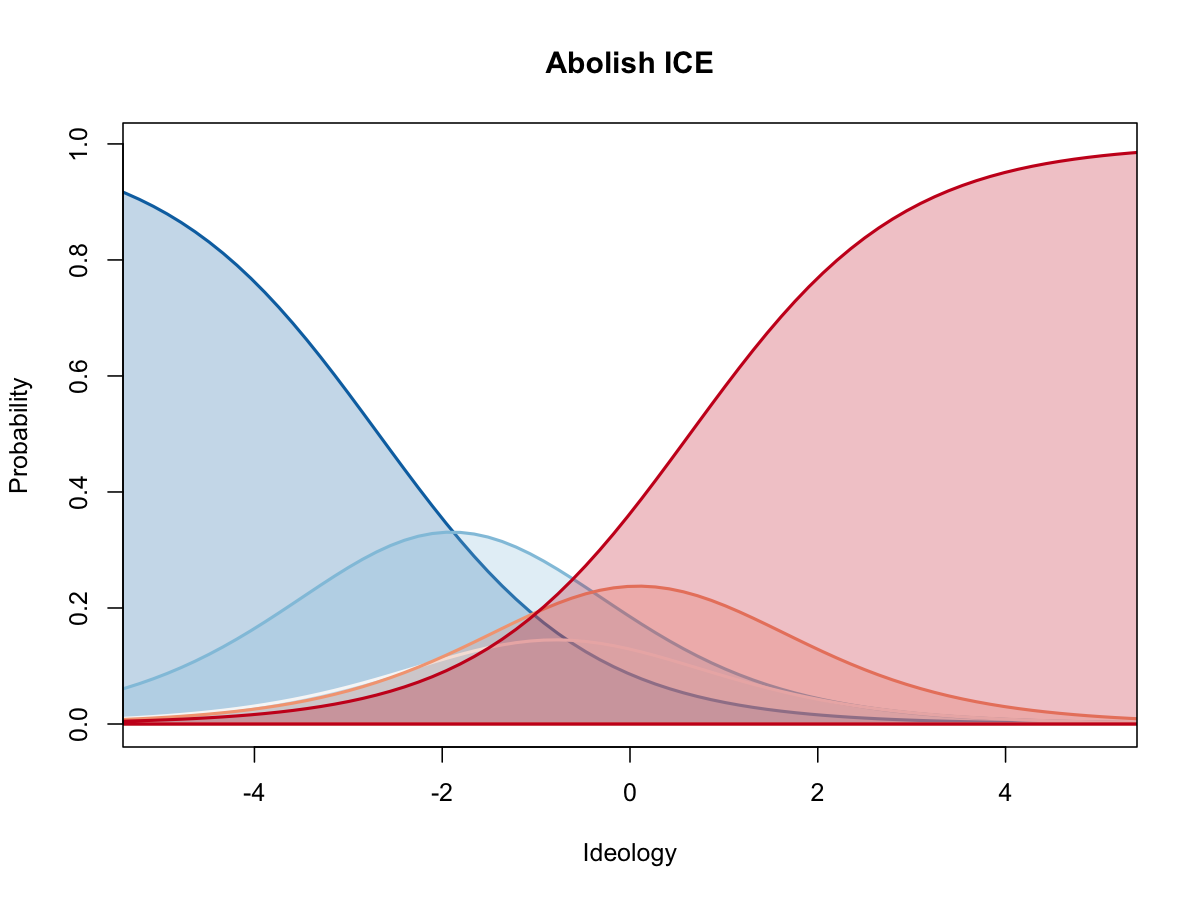
Finally, opinion on abolishing ICE shows a less favorable pattern. Moderate voters tend to oppose it. Furthermore, responses to this item are much more polarized than they are for the previous questions. Voters are not likely to state only that they “Disagree”; instead, they move directly to “Strongly Disagree.”
Some of the finds here are not surprising. Again we find that there is a group of white men that are more conservative than the rest of the population. This does narrow the scope though. Older highly educated white men are the real culprits here. A section of them are extremely conservative and pull the average to the right.
At the same time, there are many issues that the progressive movement can champion that will carry support among not only moderates but also conservatives. As I showed here, a job guarantee and public generic drugs are not extreme progressive issues, but instead garner a fair amount of support from across the political spectrum. At the same time, we should never let the current political climate, and our uncertain image of it, lock us in. Policies like Abolish ICE are important, they are just going to be a steeper hill to climb.
Kevin Reuning (@KevinReuning) is an assistant professor of political science at Miami University.
Based on Data for Progress (@DataProgress) / YouGov Blue polling fielded between July 13 and 16 with 1,515 voting eligible adults, weighted to be nationally representative. See question wording and more data analysis here.