The Role Of News Interest In Candidate Evaluation
By Sean McElwee (@SeanMcElwee)
The 2020 Democratic primary is the most polled primary in history, with many vendors releasing weekly or even daily updates to their polling. It has become increasingly clear that different polls have different “house effects,” with Morning Consult for instance being much more bullish on Biden and YouGov much more bullish on Warren. These differences are being driven at least partially by the attentiveness of the panel. Those who report following news most of the time have different preferences than those who do not. As voters’ attention to the news will change over the course of the primary, this has important implications for the decisions candidates will make as the primaries draw near. One important question is how much high and low interest voters different in ways that are relevant to support. It is possible that interest is a proxy for another variable, like education or age. We begin to answer those questions here.
In a recent YouGov Blue survey provided to Data for Progress (see the note at the bottom of this post), Democratic voters were asked,
Some people seem to follow what's going on in government and public affairs most of the time, whether there's an election going on or not. Others aren't that interested. Would you say you follow what's going on in government and public affairs
<1> Most of the time
<2> Some of the time
<3> Only now and then
<3> Hardly at all
<4> Don’t know
In a survey of likely Democratic primary and caucus voters, it probably isn’t surprising that respondents report being more engaged than do voters in other kinds of samples. Here, fully 65 percent of voters reported they followed the news most of the time, 25 percent some of the time, and the rest split among the last few options. Because attention to the news is so high, here we will mostly focus on voters who report they follow the news “most of the time” compared to the rest.
For example, voters who report they pay a lot of attention to the news also report being enthusiastic about other activities like voting. Among voters who follow news “most of the time,” about 63 percent reported they were “more enthusiastic” about this election compared to past elections, compared to only about 45 percent of other voters. (Notably, across most any subset of voters in this sample, “more enthusiastic” was selected significantly more often than “about as enthusiastic,” with barely any reporting they were “less enthusiastic” about this election compared to past elections.)

The politically engaged also differ from those who are less engaged in other ways one might expect. They are wealthier (about 22 percent of highly engaged voters earn over $100,000 per year in our sample, compared to just under 10 percent of the less engaged), more educated (48 percent have a college degree compared to just under 30 percent of the less engaged), and older (about 30 percent of the very engaged are over 65, compared to about 20 percent of the less engaged).
As we will also show, this is in some ways a fundamentally different primary for voters at different levels of political engagement. After reporting on the topline results, we will dive into how voters who follow the news closely differ from other voters in terms of the candidates they prefer.
Early in our survey, we asked voters to report who they were considering voting for among the candidates still in the race. Respondents could choose as many candidates as they were considering. Across the full sample, the basic lay of the land has remained unchanged over the past few weeks, with Senator Elizabeth Warren enjoying a slight advantage and Vice President Joe Biden, Senator Bernie Sanders, mayor Pete Buttigieg, and Senator Kamala Harris rounding out the top five.

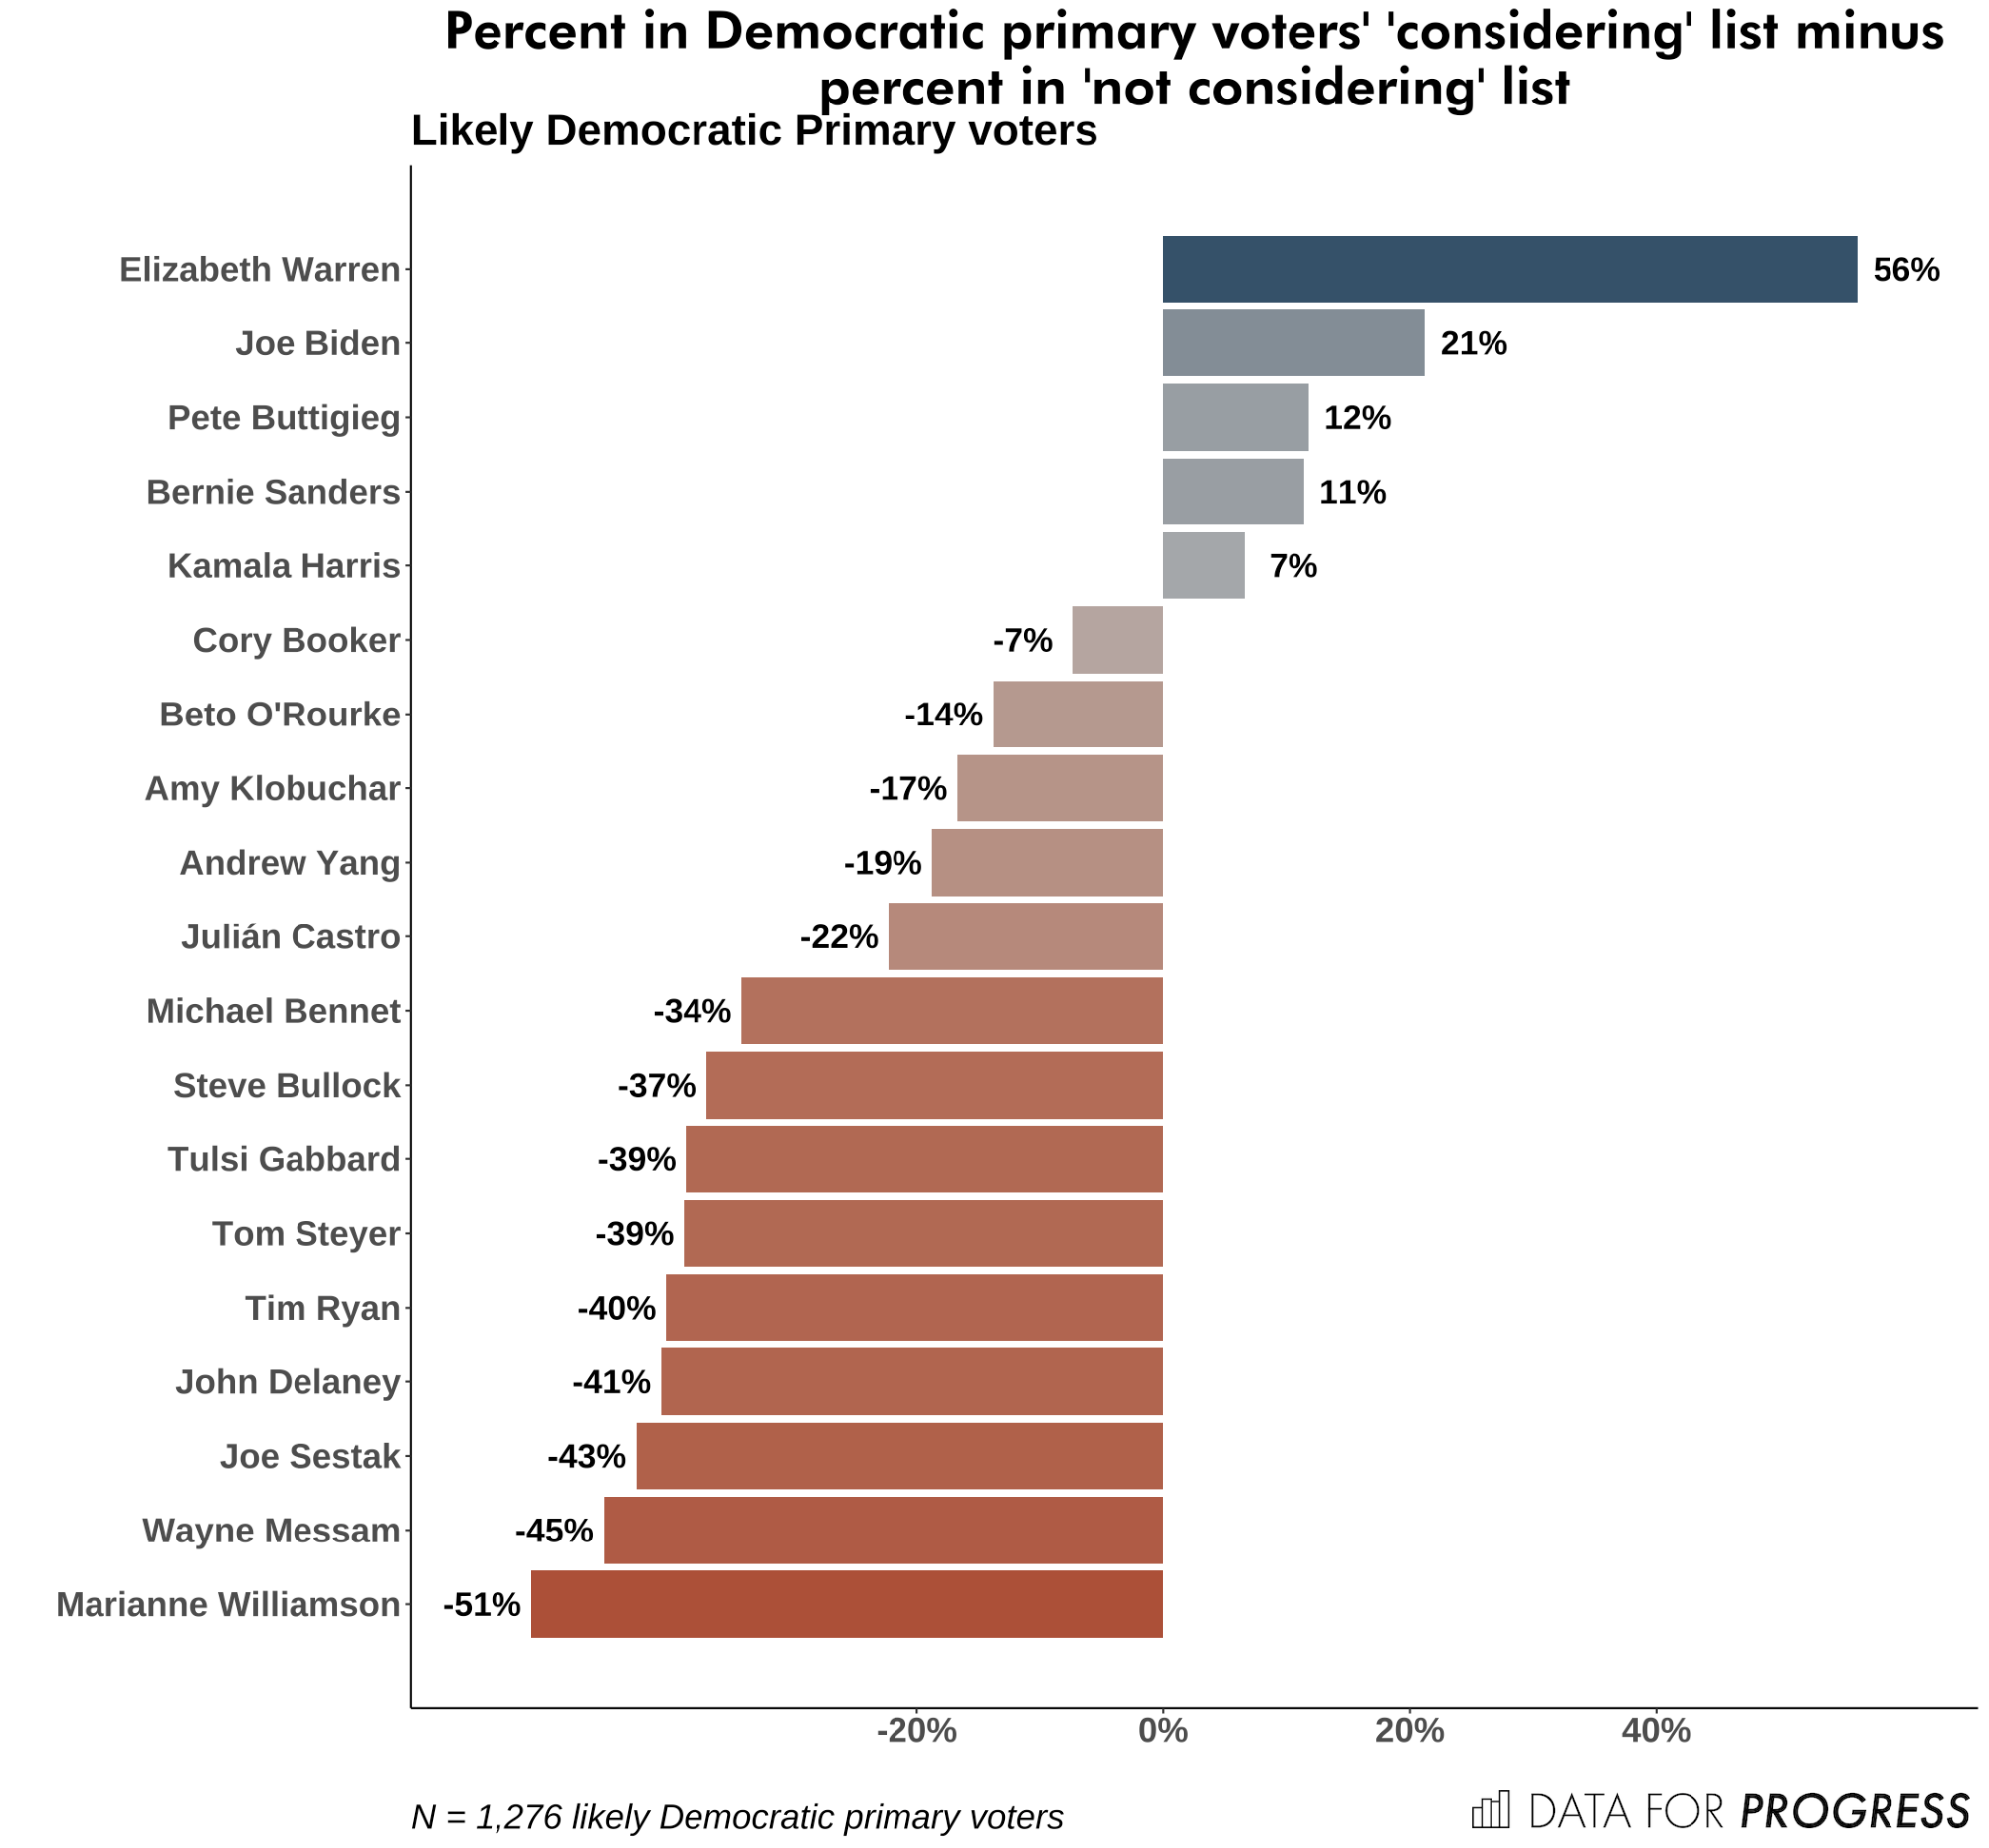
The following chart shows the same information with the share of Democratic primary voters considering each candidate minus the share who said they were not considering those candidates. Viewed this way, we can see there are only a few candidates on net being considered by more voters than not considered. Unlike some of our earlier studies on the Presidential primary, voters’ preferences may have begun to narrow.
The views of Black and Latinx voters are going to be uniquely pivotal in 2020, with several of the most important Senate races and Presidential battlegrounds happening in states where the Black and Latinx votes will be decisive. Net considering for each candidate by race/ethnicity and sex shows that, while the approximate order of candidate net support is about the same across Black and Latinx voters, there are some notable gender divides. Vice President Biden’s support is 16 points higher among Black women than men, for example, but is also considerably higher among Latinx women than men. While support for Senator Sanders is about the same among Black men and women, his net support among Latinx men is almost 20 points higher than his net support among Latinx women.

In aggregate, Vice President Biden currently enjoys strong support among Black voters compared to others, while Senator Warren performs stronger across all other demographics. Businessman Andrew Yang’s support is much higher among “other race” voters, a category that includes Asian Americans. Senator Sanders enjoys a particular advantage among “other race” voters, as well.

How does attention to the news influence voters’ candidate preferences? The following chart breaks out the overall “Considering” result among voters who are paying attention to the news and those who are paying less attention. This breakdown reveals significant differences in candidate preference by news attention.
For example, fully 74 percent of Democratic primary voters who follow the news “most of the time” are considering Senator Warren, a 20-point gap above those who are not following the news most of the time. The biggest gulf among the top contenders includes supporters of Pete Buttigieg. Just 17 percent of Democratic primary voters who aren’t following the news “most of the time” are considering him, but over twice that amount, 40 percent, of those who follow the news most of the time are considering him.

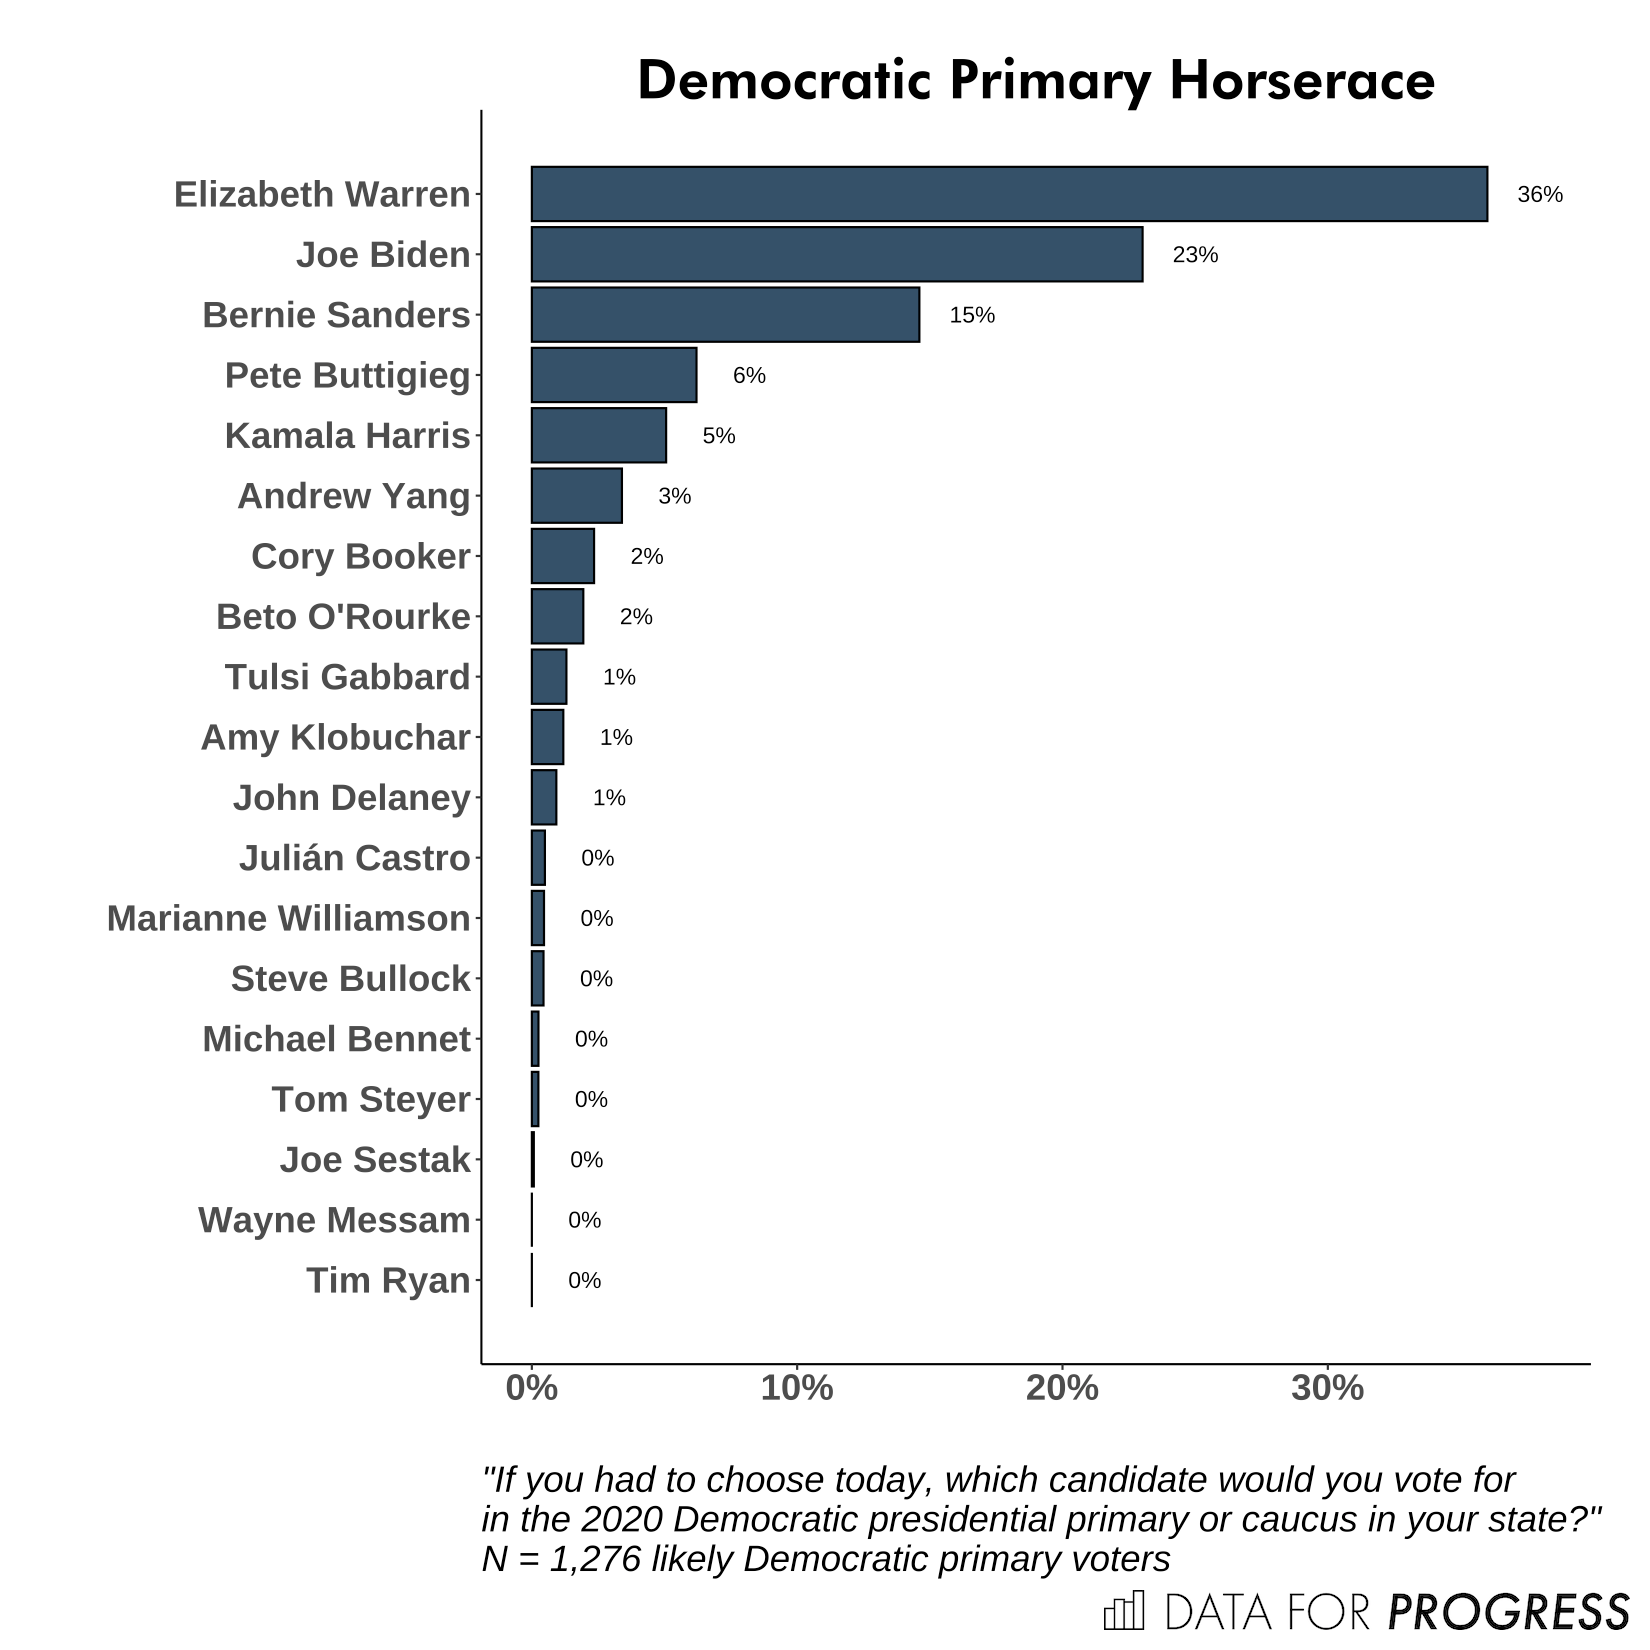
Later in the survey, we asked a more traditional “horse race” item, which constrained voters to pick just one candidate to vote for. We asked,
If you had to choose today, which candidate would you vote for in the 2020 Democratic presidential in your state?
By that measure, we once again find that the race is dominated by Elizabeth Warren, Joe Biden, and Bernie Sanders.
Examining horserace, the race is just as divided along the lines of news attention. There is a 16-point gap in support for Warren by news attention, and a 7-point gap in support for Sanders. By either measure of news attention, Biden is performing strongly.
Broken out by race/ethnicity, we see that the same general order in candidate preferences holds. Both Vice President Biden and Senator Warren perform strongly among Black voters who pay close attention to the news. Support for Warren among white voters is a full 17 points stronger among those who pay close attention to the news.

Broken out by race/ethnicity, we see a similar result. There is a roughly 20-point gap in support for Warren by news attention among both white and Latinx voters. There is about a 23-point gap in support for businessman Andrew Yang among “other race” voters. Twenty-six percent more white voters who follow the news closely support Pete Buttigieg than white voters who do not.

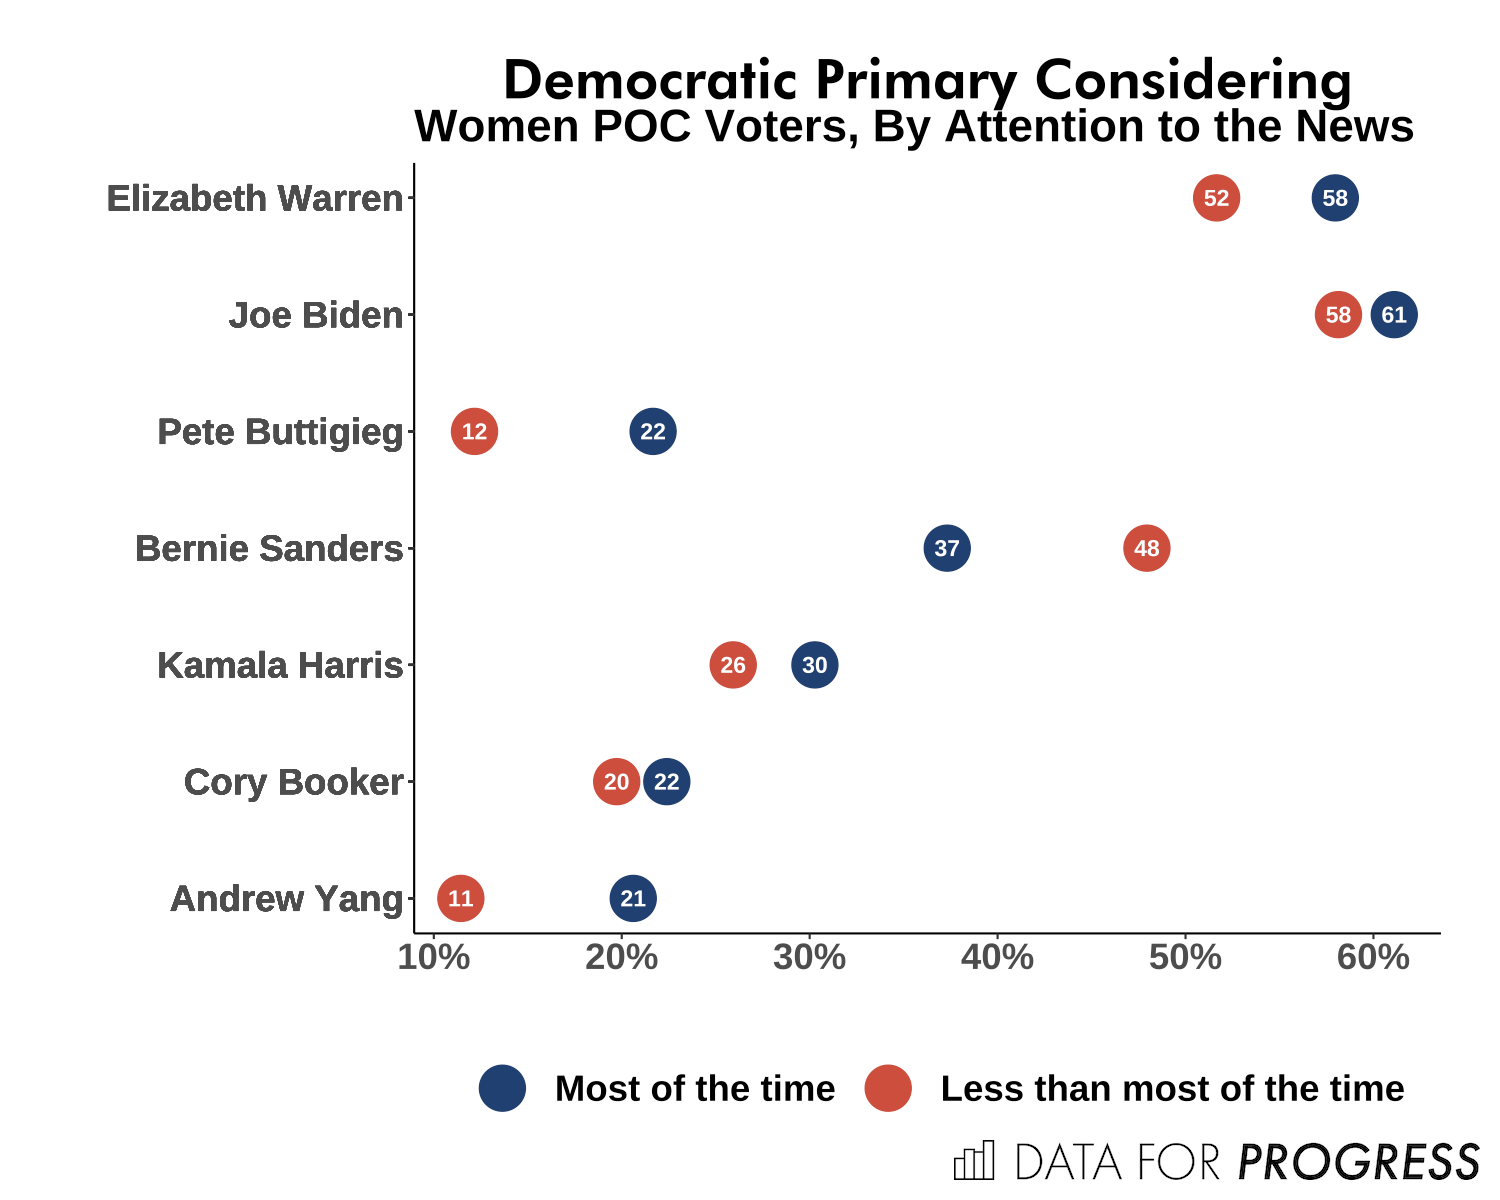
These gaps in candidate support are uneven across gender. For example, the “news attention gap” in support for Warren among Black voters appears to be driven by men. The news attention gap for Warren among Latinx voters is roughly twice as large for men as it is for women. Note that there is virtually no news attention gap among Black women who support Elizabeth Warren, and so the circles overlap for that particular subset of voters in the following chart.

As we mentioned at the outset, attention to the news is highly correlated with other factors like voters’ education and age. As such, it is probably not surprising to see that these results are quite similar if we simply break them out by age:

And by education, as well. Support for each of the frontrunner candidates is highly influenced by how much attention to the news voters report they are paying.

Among women non-white voters in particular, the support gap for Warren is smaller, as measured by either considering or by horserace, while support gaps for mayor Buttigieg and Senator Sanders are still apparent. However, when constrained to only choose one candidate, many of these gaps shrink down. There is almost no news information gap in horserace preference among women non-white voters for Biden, Warren, Senator Kamala Harris, or Senator Cory Booker.

Finally, while news interest is correlated with age, income, education, and other factors, news interest correlates with candidate support even controlling for those factors. The following plot presents standardized coefficients from four logit models, with support for each of the top few candidates as the dependent variable of interest. The coefficient out to the right on the “News Interest” variable suggests that news interest is positively correlated with support for Elizabeth Warren, and the coefficient out to the left suggests that news interest is negatively correlated with support for Bernie Sanders, controlling for other factors like education, age, race/ethnicity,.

And the following chart breaks out the share of voters who report they are following the news “most of the time” by age and education. There is a general upward trend in attention to the news by both education and by age. Across education levels, those of retirement age are the ones paying the most attention to the news.

The implications of these results are not immediately clear for any campaign. One possibility is that as voters begin to pay more attention to the primary, aggregate preferences may start to more closely resemble what highly attentive voters currently think. Another might be that early activists are not representative of the population that will ultimately participate in the primary, and as such these results aren’t necessarily good or bad news for anyone.
As such, understanding how voters currently paying attention differ from those who aren’t provides an interesting but probably limited insight into where things are headed. While the news attention gap bodes well for several candidates for this reason, each should be preparing for what will happen when the share of voters paying attention starts to pick up.
Play with the data
Here, we have embedded a Crunchbox so that you can play around with the data yourself.
Sean McElwee (@SeanMcElwee) is a co-founder of Data for Progress.
Pollster’s note: YouGov Blue fields a regular omnibus survey of Democratic primary voters and opted to share a subset of the data from the wave that ran from 9/23/19-10/4/19 with Data for Progress. We note that in this survey, we found particularly high support for Senator Elizabeth Warren. While we are as surprised by this result as anyone, we’re reporting this result in full and have included a widget at the end of this post so that readers can explore how the data looks by political and demographic groups of interest. But we won’t bury the lede: We find that Senator Warren’s horserace support is currently at about 36 percent, which is higher than other polls. This survey fielded with YouGov, which this cycle has been a leading indicator of Warren support, having detected a Warren lead several weeks ago that is now matched by other national polls in rank if not necessarily magnitude. The survey was fielded by YouGov Blue and is not publicly released in full, meaning it is not considered for debate qualifying purposes the way some public YouGov surveys are.
While YouGov Blue's registered voter omnibus, which Data for Progress often uses elsewhere, is weighted to the population of US voters, the Democratic Presidential omnibus is weighted on a full sample to the population of US voters and is then subsetted to likely Democratic primary voters and is also matched to several commercial voterfiles. As such, the weighting strategy for the Democratic Presidential omnibus differs slightly from weighting on other kinds of surveys.
The survey was weighted to be representative of the population of likely Democratic by age, race/ethnicity, sex, education, US Census region, and 2016 vote choice. Voters were screened by whether or not they were very likely to vote in their state’s Democratic primary or caucus.