Here’s How Voters Might Move Tonight
By Sean McElwee (@SeanMcElwee)
As the next Democratic debate gets underway, we present new data on how voters feel about each of the candidates remaining in the primary, and how those voters might shift depending on the candidates they currently favor and disfavor. While Massachusetts Senator Elizabeth Warren currently leads the pack, we also find that she is the most popular second-choice candidate for voters who currently support other front-runners. Unlike past surveys, which found that supporters of this or that candidate tend to approve of Democrats across the board, we’re now finding significant variation in how supporters of each candidate feel about the other candidates. Although we don’t find clean “lanes” we do find that supporters do see ideological differences among candidates. For instance, unlike some pollsters, we find that the second place choice of Sanders supporters is Warren, not Biden, suggesting that voters do see the two candidates as ideologically similar.
As part of the survey, we asked voters to report who they were considering voting for in the upcoming Democratic primary or caucus in their state. Specifically, we asked,
Thinking about the 2020 Democratic presidential (primary or caucus) in your state, which candidate or candidates are you considering voting for? Select all that apply.
With voters selecting as many candidates as they were considering voting or caucusing for. After that item, voters who reported they were considering more than one candidate were asked to rank their candidates from most preferred to least preferred. To prevent the exercise from being too burdensome, we allowed respondents to rank up to five candidates they had selected. Fully 98 percent of respondents had at least one preference, and 82 percent had at least two preferences, but after that, the share of voters with third place, fourth place, etc., candidates drops off quickly. As such, we focus here on the first and second place choices by voters in our sample.
The following table shows how voters rank their second choice candidates. The table reads from left to right: For example, 8 percent of Biden voters say their second choice is South Bend, Indiana mayor Petet Buttigieg, 4 percent say their second choice is Senator Kamala Harris, and so on. About 33 percent of Biden voters have no second choice, as indicated by the very rightmost column, and about 10 percent prefer one of the other candidates not included in the table, as indicated by the “Other” column.

Notably, we found that almost all voters who support Senator Elizabeth Warren have at least one additional choice while, for example, about a third of voters who currently back Senator Biden, Beto O’Rourke, or Senator Bernie Sanders currently have no second choice.
We also find that Warren is far and away the preferred second choice for supporters of other candidates. About 29 percent of Biden supporters, just under half of Harris supporters, and about 43 percent of Sanders supporters say that Warren is their second-place choice for Democratic presidential nominee. At the same time, Senator Warren’s supporters are about evenly divided between Vice President Biden, mayor Buttigieg, Senator Harris, and Senator Sanders for their second choice.
While in previous work we found that news interest itself was a significant predictor of candidate choice, we find those differences are smaller for predicting second candidate vote choice. Additionally, as the sample sizes are smaller at different levels of news attention, it is difficult to draw many firm conclusions about how high-news interest voters might differ from others. Among voters who report they follow political news “most of the time,” Warren remains the clear preferred second-choice candidate, and Warren supporters who follow news “most of the time,” like other Warren supporters, break out about evenly among Biden, Buttigieg, Harris, and Sanders.

Later in the survey, we asked voters to report their favorability or unfavorability toward each of the candidates still in the race, regardless of whether or not they reported support those candidates or not. While some of our prior surveys have found that Democrats overall like pretty much all of the major candidates, we are not starting to see some variation on this question. We asked voters,
How a favorable or unfavorable do you regard the following candidates?
With respondents able to choose between very favorable, somewhat favorable, somewhat unfavorable, very unfavorable, or unsure.
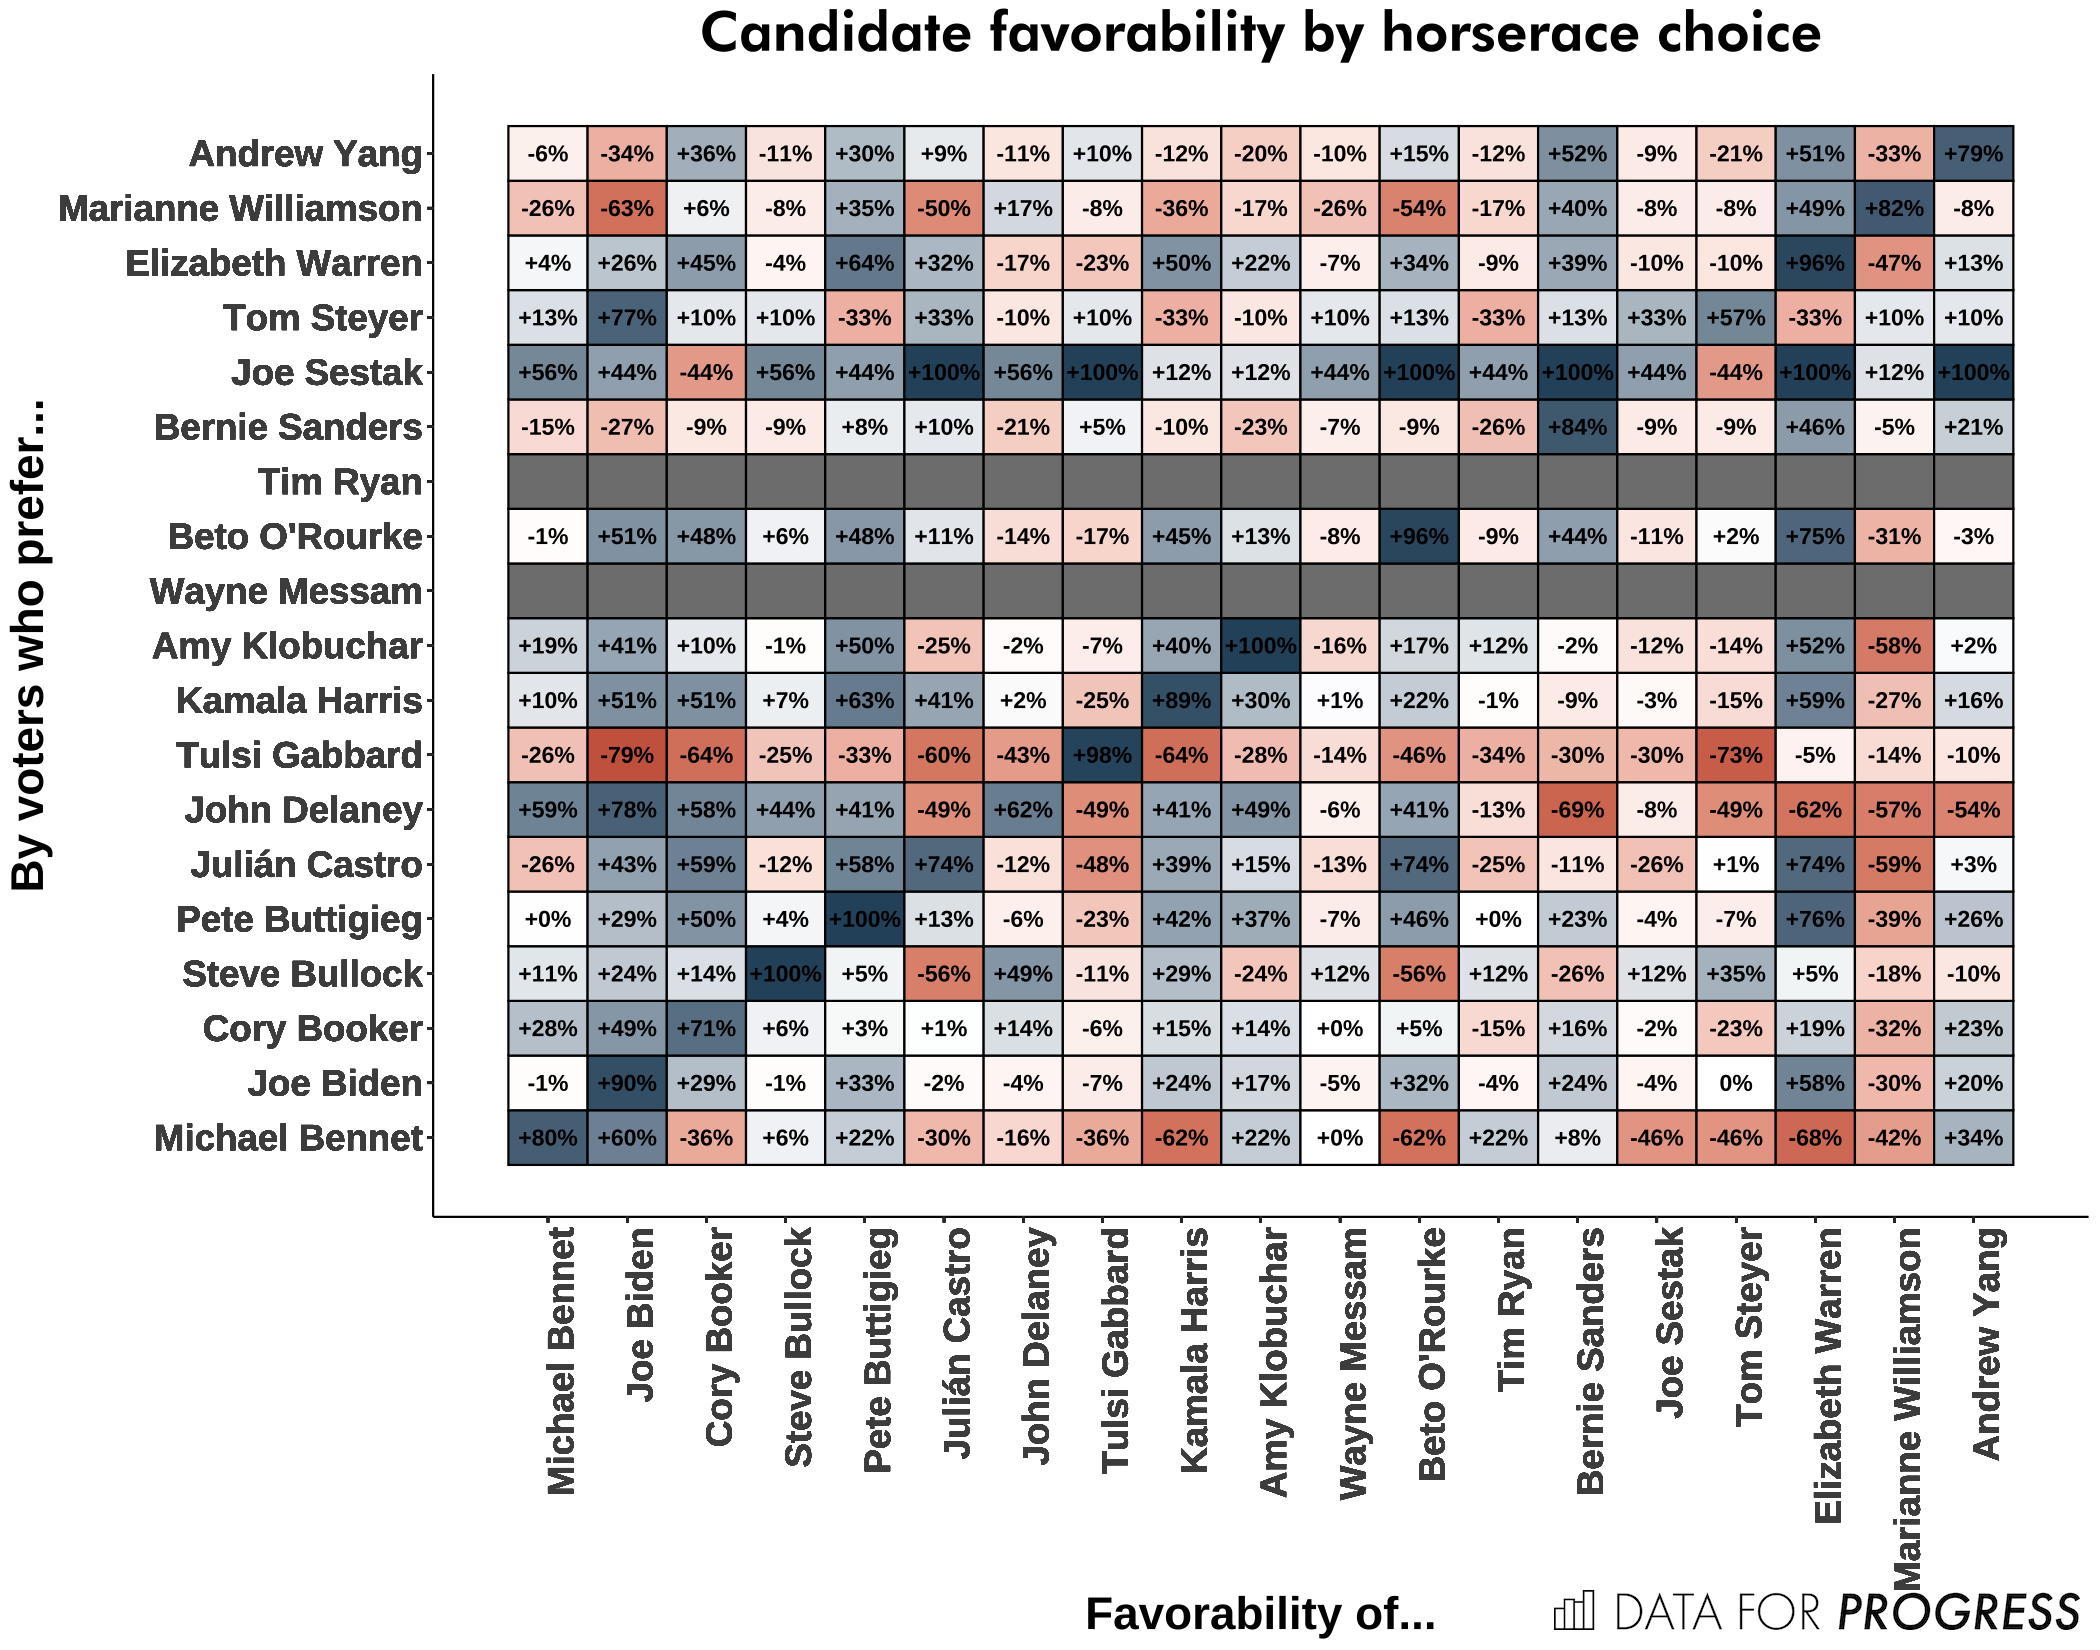
The following chart plots net candidate favorability for all of the candidates still in the race, broken out by voters who selected each of the candidates in the horserace item. Each square in that chart represents the percent of each candidate’s supporters who favor each of the other candidates, minus the percent of each candidate’s supporters who disfavor the others. For example, the top left square reads “-6%”, indicating that entrepreneur Andrew Yang’s supporters’ net favorability of Senator Michael Bennett is -6 percent on net. The very top right square indicates that Andrew Yang’s net favorability among his own supporters is +79 percent. Squares are shaded from dark blue (very high positive net favorability) to dark red (very high negative net favorability). The row of white squares on Bernie Sanders’ row suggests that Sanders’ supporters, for example, are split on many of the other candidates.
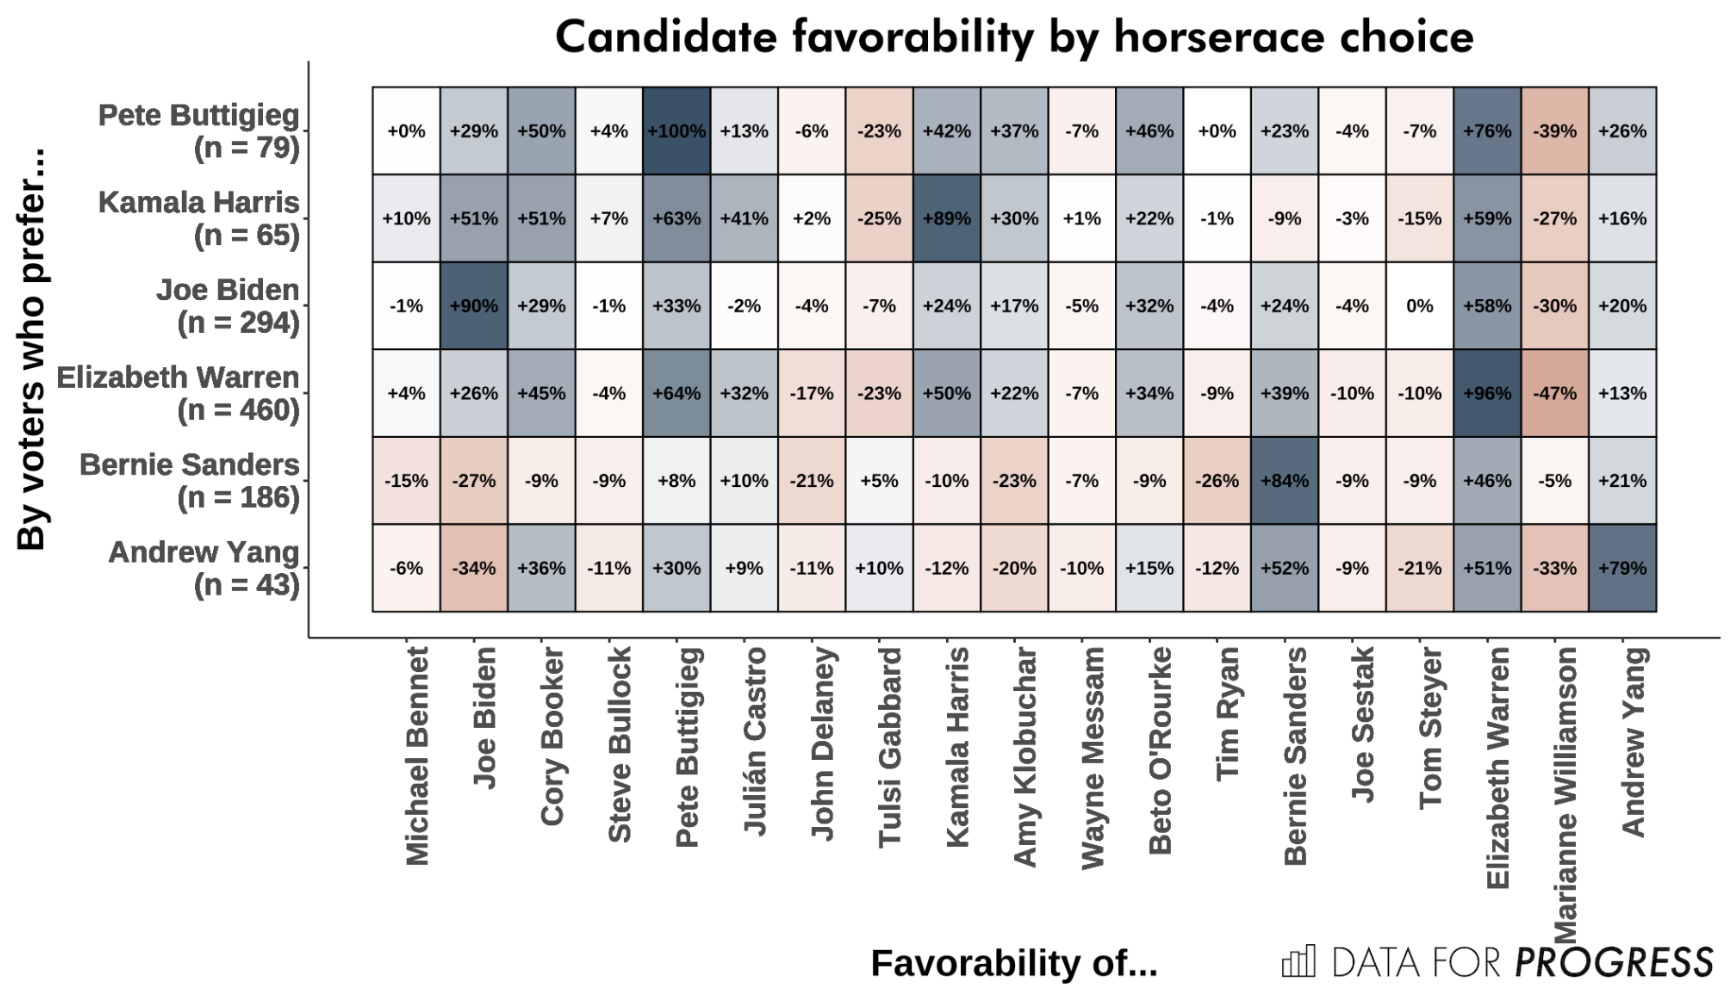
If we look at the candidates who currently have the highest level of support (here, we use a cutoff of 40 respondents or above), the differences are more muted. While favorability across the board of Elizabeth Warren is high on average and favorability toward Marianne Williamson is lower, net favorability of other candidates is more closely centered around zero. Vice President Biden enjoys very high net favorability among supporters of Senator Warren, mayor Buttigieg and Senator Harris, and has lower net favorability among supporters of Senator Sanders and Andrew Yang. Among supporters of the leading candidates, however, net favorability is generally more muted one way or the other than it is among supporters of lower-tier candidates.
Voters’ ranking of candidates correlates highly with their favorability of those candidates. While this may sound obvious, some of our past surveys of the Democratic primary did not actually find much of a relationship between those two items. Here, we show that voters are about 20 points more favorable toward their second-choice candidates than to their other choices.

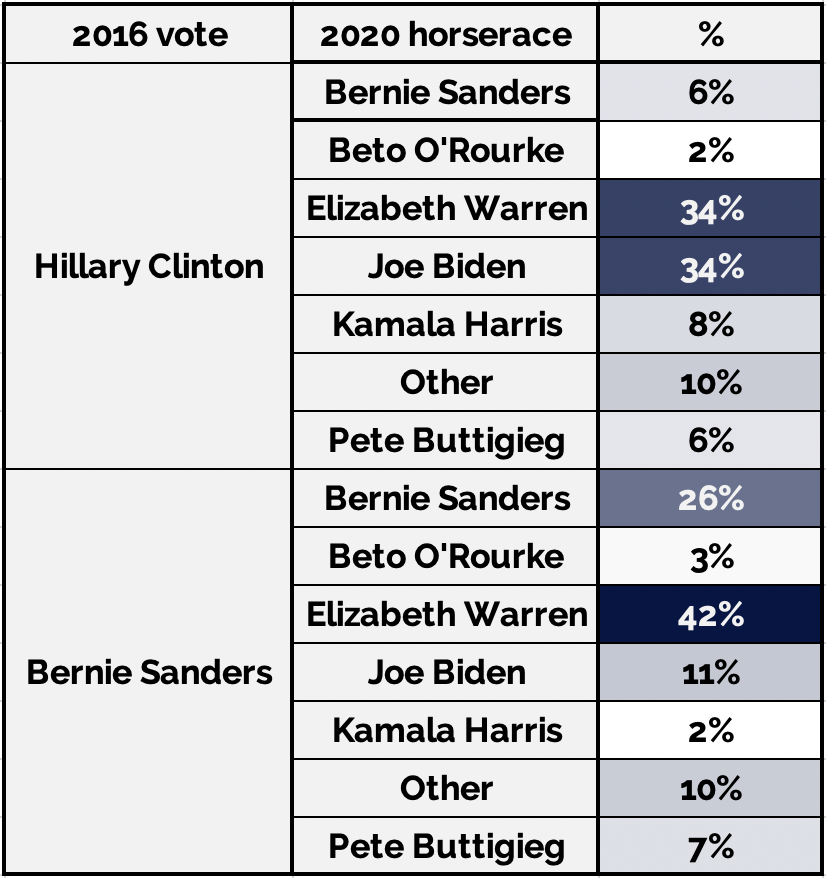
While 2016 was largely narrated as a contentious race between Secretary of State Hillary Clinton and Senator Bernie Sanders, we are also finding that voters who backed either candidate in 2016 have begun to even out without much relation to the previous cycle. Our survey also included an item on who respondents voted for in 2016. Among those who voted or participated in a caucus in 2016, we do not find as stark of a divide as one may expect.
For example, roughly similar shares of Clinton and Sanders voters, about 34 percent and 42 percent respectively, currently report they support Elizabeth Warren. While only about 6 percent of Clinton voters or caucus-goers report they currently support Sanders, Sanders’ current number among 2016 Sanders voters is not much higher than his current horserace vote share, at about 26 percent.
Ultimately, we have found little evidence of dramatic movement for or against any candidate on the basis of the debates. Voters likely move around on the basis of other factors. While some candidates’ supporters appear to be open to other candidates, others do not favor many other candidates besides their own. But either way, over 80 percent of likely Democratic primary voters or caucus-goers support more than one candidate, and so we are likely to continue to see movement, even if individual debates rarely prompt much movement on their own.
Sean McElwee (@SeanMcElwee) is a co-founder of Data for Progress.