Extreme Poverty is on the Rise in the US
By Colin McAuliffe (@ColinJMcAuliffe)
A recent episode of the Citations Needed podcast took a critical look at what they called the “Neoliberal Optimism Industry”, where various public figures such as cognitive psychologist Steven Pinker tout various statistics purporting to show rapid improvements in quality of life for people around the world. This is mostly true, but a closer look at some of the data reveals that the optimists are overstating their case. The guest on the podcast, Jason Hickel, went into depth on why the widely cited figures on rapid decline of extreme poverty are not quite what they seem.
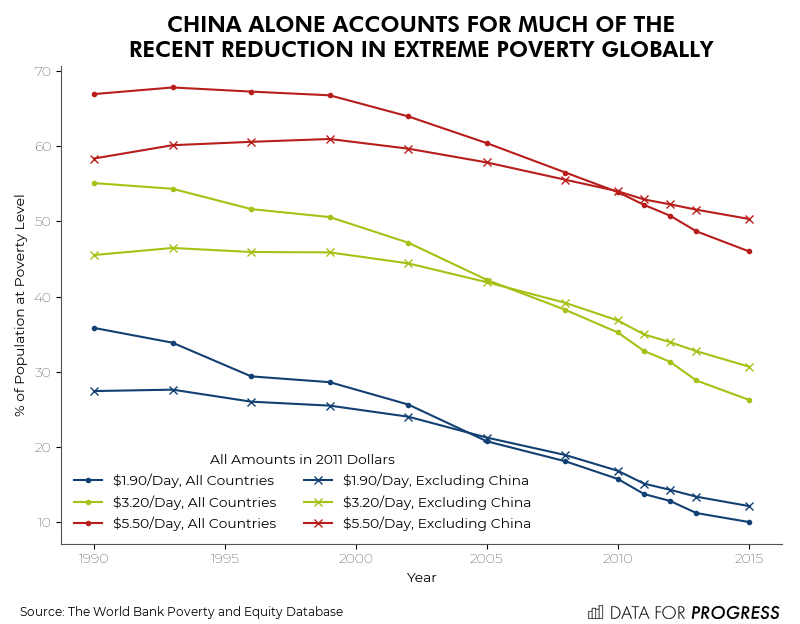
First, Hickel notes that the poverty measure most often cited is the equivalent of $1.90 per person per day in 2011 US dollars. This metric was devised by the World Bank and is based off of poverty levels set by nations in the lowest 25 percent of GDP. This measure represents an extreme level of deprivation, which is why world bank also uses two additional poverty measures, $3.20 and $5.50 per day in 2011 US dollars. These are representative of poverty levels set by countries in the 2nd and 3rd income quartiles respectively. For comparison, the poverty level in the US is about $21.70 per day in 2011 dollars. The focus on the fact that the rate of people living on $1.90 a day is approaching 10 percent hides the prevalence of poverty at the $3.20 and $5.50 levels, which themselves are still dire.

Hickel also points to the fact that much of the global reduction in poverty rates at all levels are driven by China, where millions of people have recently been lifted out of poverty. After excluding China, the recent poverty rate reductions are more modest. That is not to say that poverty reduction in China is not important, of course it is, but since it is an outlier we should be careful when trying to construct narratives from the global poverty rate.
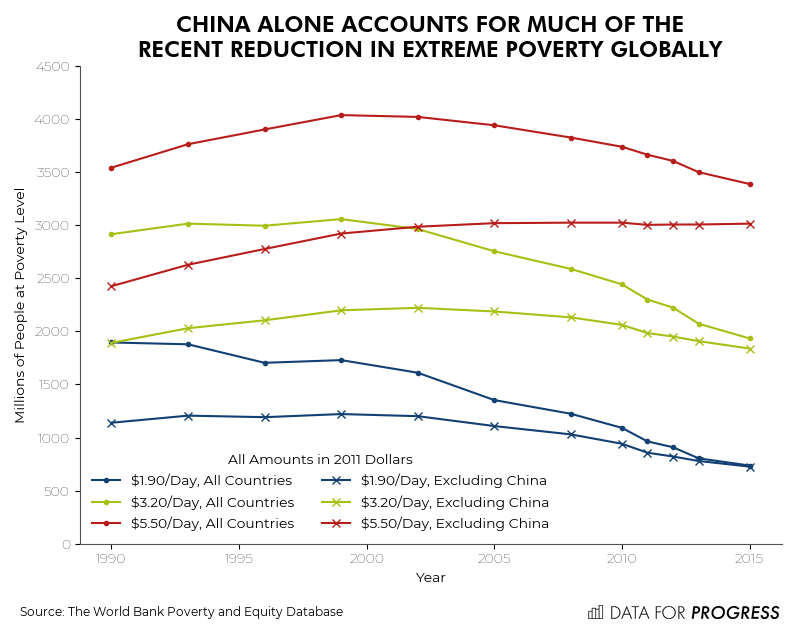
Hickel argues that the poverty rate itself can be misleading since the global population is growing, meaning that the poverty rate can go down while the absolute number of people living in poverty can go up. These data (again we show rates with and without China included), look much less encouraging.
Noah Smith recently argued that the way poverty is typically measured in the US doesn’t adequately capture reality, and showed that poverty in the US looks a lot worse when you measure it by the volatility in someone’s income. This is certainly an important and useful measure, but even the more old fashioned world bank levels reveal a staggering trend of increasing extreme poverty in the US, both in terms of absolute numbers and in rate.

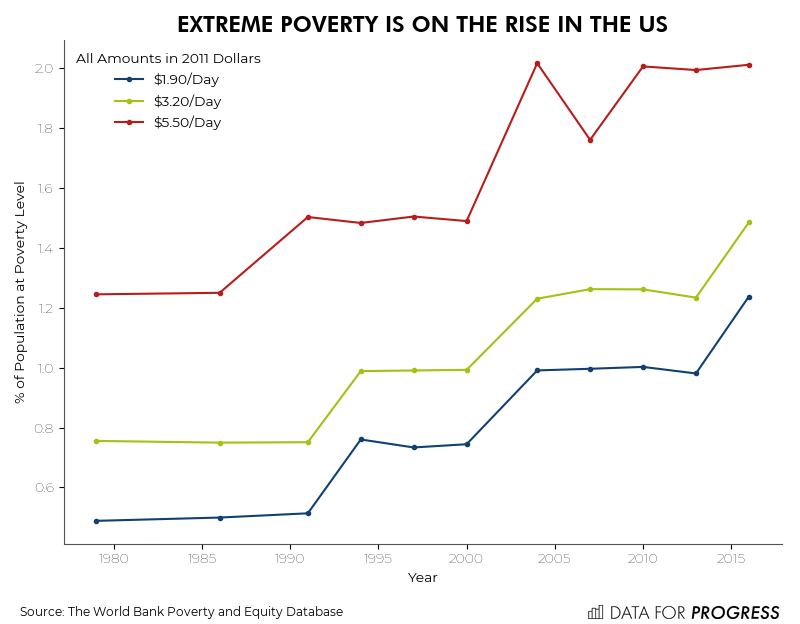
The growth of extreme poverty in the US starting in the early 1990s can be traced back to welfare reform under Bill Clinton, where policy shifted away from cash benefits and towards subsidies for low wage work through programs like the Earned Income Tax Credit. This is not a state of nature however, and we can create a fair economy by moving beyond subsidies for low wage work and ensuring unconditional basic income for everyone, in addition to guaranteeing a good job for anyone who want one.
Colin McAuliffe (@ColinJMcAuliffe) is a co-founder of Data for Progress.