Introducing the Election Night Integrity Project
By Charlotte Swasey VP of Data & Polling
Election nights are a whirlwind. With “expert” pundits on cable news trying to crank up the drama for and social media amplifying every salacious rumor it can be impossible to know whats going on. And this year, in the middle of a pandemic which makes this election unlike any before, it’s more important than ever that we have reliable, accurate information on election night.
That’s why we’re thrilled to roll out our newest project, the Election Night Integrity Project. This is a tool to help visualize and interpret election results, with a focus on reliable information over attention-grabbing graphics and ensuring that we make every vote count.
The Story
I’ve been doing election night reporting for a couple cycles now. I’ve spent a lot of time talking people down from making wild conclusions based on a tiny number of votes. I also was running an election night program during the Iowa caucus where I saw firsthand the importance of having accurate information on a chaotic election night.
A few months ago, I realized this election night, the stakes are higher than ever. This is why I came up with the idea for the Election Night Integrity Project, which makes the information only available to select political professionals available to everyone. Typically, this is a niche task. Folks on campaigns, PACs and advocacy orgs do it, to decide where to send last minute volunteers and legal support, or because they need a comms strategy. Normal people don’t spend their time looking at how Montgomery county is coming in and what that lets you project from 5% of total votes.
This time, there are serious concerns that elected officials or private citizens might misinterpret the difference between super early results and final results as election manipulation or a sign of wrongdoing. Results have high variance as they come in, and without experience reading them, it’s easy to get freaked out by fluctuations that are actually very normal.
With record numbers of people paying close attention to election returns, I felt it was important to give them access to the sort of dashboard you’d use if you worked in politics, one that could give you information -- but more importantly, give you context. This idea became the Election Night Integrity Project, our dashboard where you’ll be able to watch results roll in while also seeing useful benchmarks, like past results in the state and the number of votes cast in 2016.
The Project
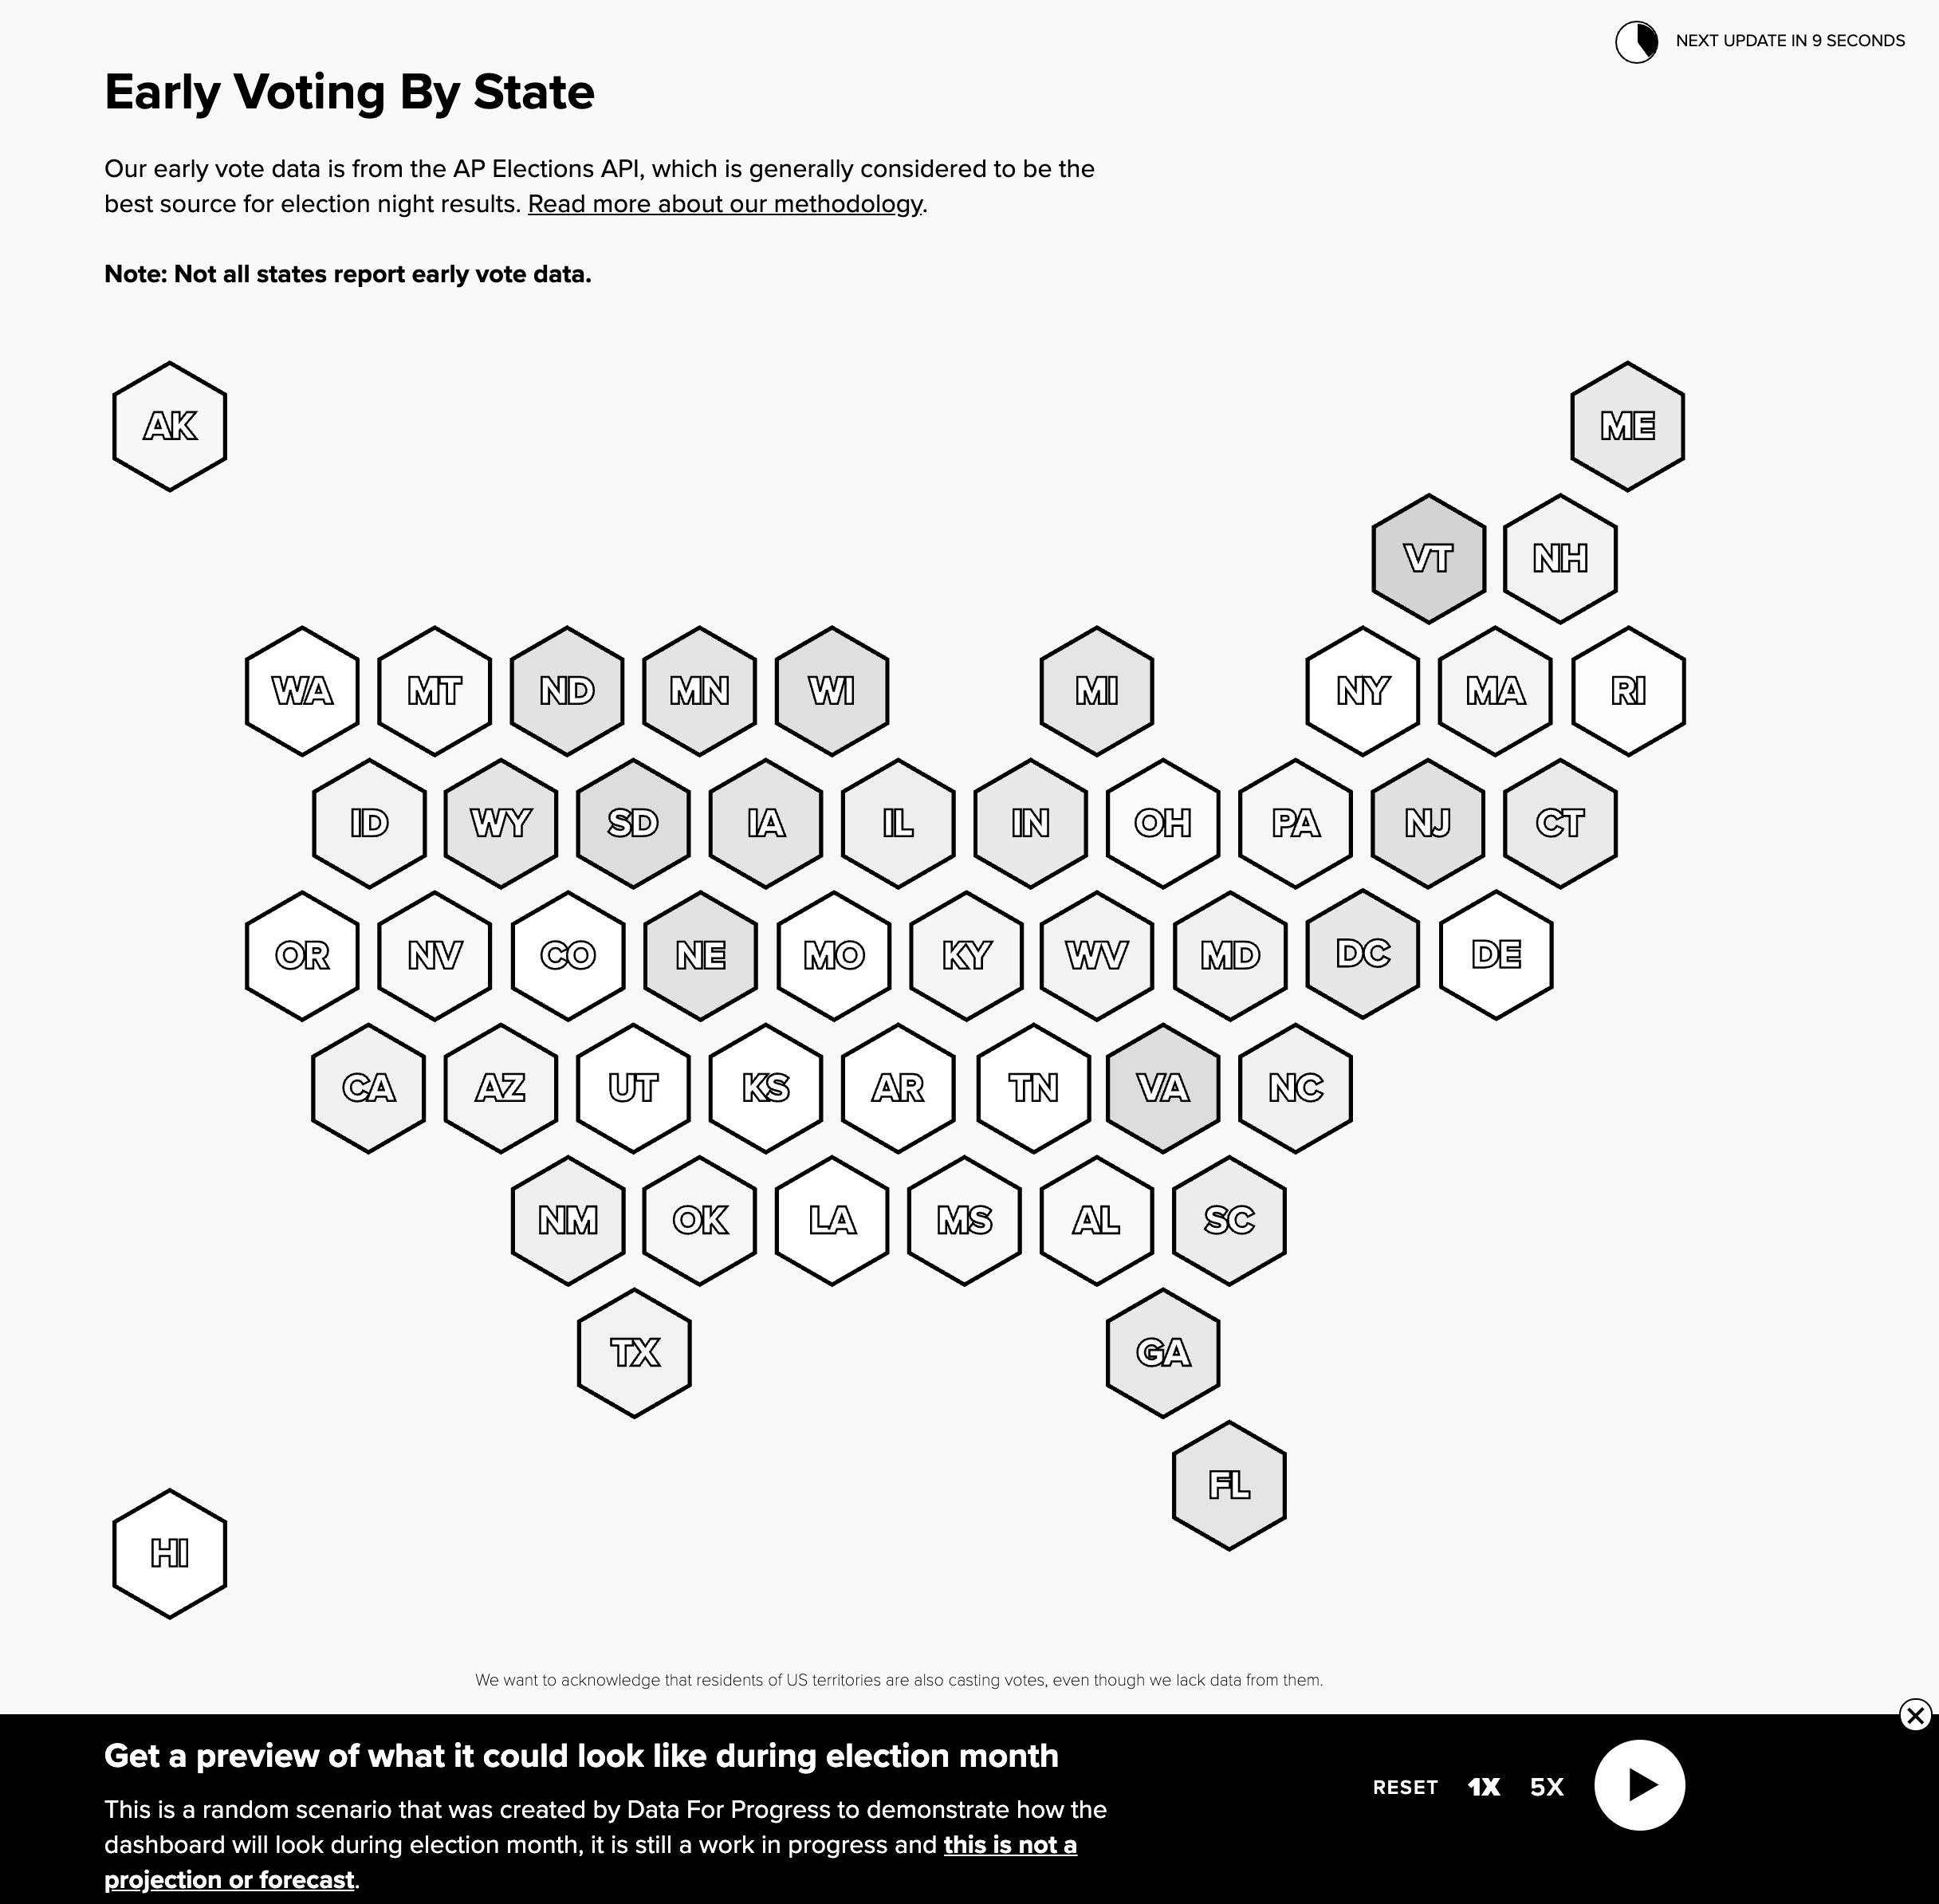
First off, our dashboard. This gives you access to live results as they come in, as well as early vote data. The dash has useful viz to help you understand what you’re seeing—try checking out the demo mode and clicking through states to get a taste of what it will be like on election night.
Second, our guides. These are short, digestible pieces aimed at getting you up to speed with understanding how election night and the days that follow might pan out.
We’ve got Election Night 101 up already, and more to come. The 101 through 301 series are aimed at getting you oriented in how results get from polling places to your computer screen, and warning you about a couple common pitfalls. We’ll also be adding a guide on how experts extract information from small numbers of results. If you take anything away from this project, read Election Night 101 and then take several deeeeeep breaths and pick up a soothing hobby for election night. I recommend getting a book.
What are we not giving you?
This tool will not have an election forecast, a prediction, or attempt to beat anyone to call races. We’re using AP data and other public information, and if anything we’re likely to be slower about marking races called, since we feel it’s really important to be cautious about this.
We’re also not an official source of results. The only people who can declare a race truly over are election officials, and you should always double check state and county website if you need certified results.
Finally, we can’t be there in person to tell you to take a breath and wait for more data to come in, so you’ll have to provide that yourself.
Where can you find us?
Check us out at 2020.dataforprogress.org, and check back in the next few weeks for more features as we roll them out.
On election night (or election month? As long as it takes), our dashboard will be pushing updated data as we get it, and our team will be adding their own commentary to help you understand any oddities that pop up.
We know we can’t cover everything you might want, so we’ll be linking to various partners that have useful tools and resources around election returns and elections in general.


