Exploring a Working Families Tax Credit
As part of Polling The Left Agenda, our deep dive into the political viability of major progressive policies, the idea of a Working Families Tax Credit drew our attention. As explained by Economic Security Project, a major proponent of tax reform to benefit lower income people, “The Working Families Tax Credit puts more money back in the pockets of the working and middle-class people who need it most.”
What it is: providing a leg up out of poverty and a cushion of financial stability
The idea is gaining attention, most recently with Sen. Kamala Harris introducing her version as the LIFT the Middle Class Act: If you work, earning less than $100,000 a year, and you’re married or have children, you would receive up to $500 a month. Single workers would receive up to half that amount, if they earn less than $50,000. The monthly credit would provide working families with a leg up out of poverty and a cushion of financial stability. Low-income students would also be eligible for the credit.
Other recent legislation achieves the same goal through expanding the earned income tax credit (EITC), which works by topping off the incomes of low wage workers. Rep. Ro Khanna and Sen. Sherrod Brown would push the EITC further up into the middle class, with a much more generous credit. Rep. Bonnie Watson Coleman would add family caregivers and students, recognizing those who are giving back to society even if they don’t have income from a formal job--an important first step towards more universal programs. Watson Coleman’s bill also offers an option to receive the benefit monthly, helping even out spikes and dips in earnings that can be a real hardship on struggling families.
Strong support among voters across the political spectrum
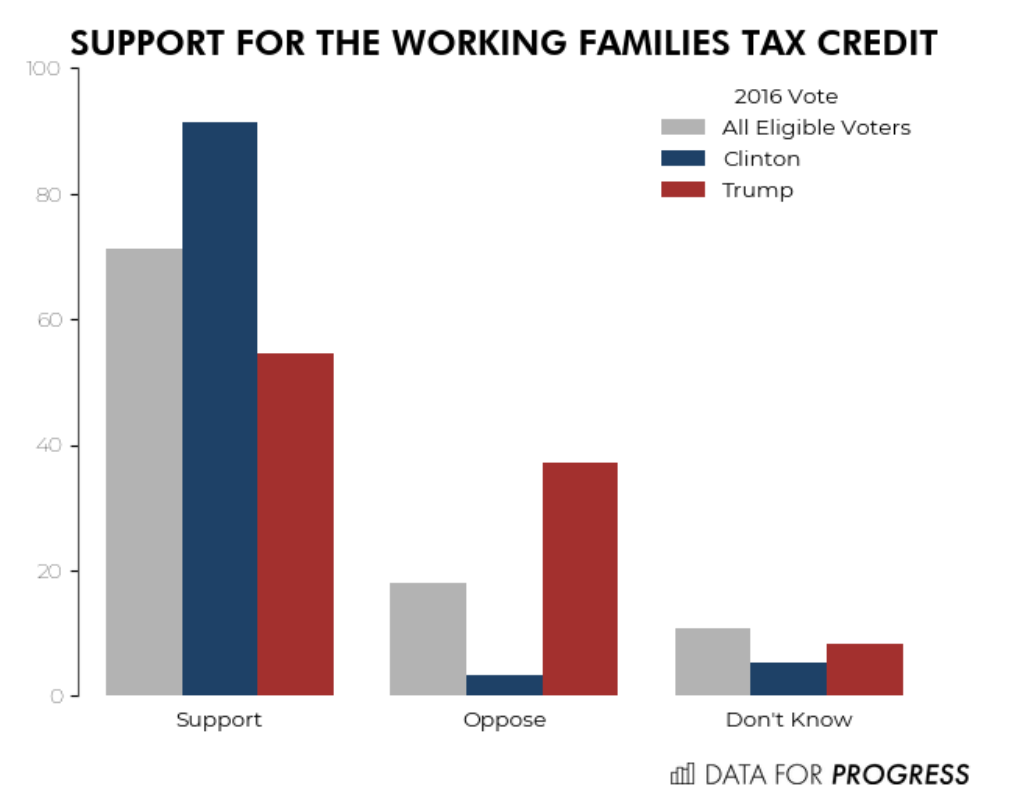
In September, YouGov Blue conducted a poll commissioned by the Economic Security Project and provided to Data for Progress, which asked, “Do you support or oppose a proposal to give a tax cut to lower and middle-income taxpayers, paid for by a tax increase on high-income people? The details of this tax reform proposal are: Taxes would be raised only on those making over $500,000 a year and no one earning less would pay any new taxes. The money raised would be required to fund tax refunds of up to $2,000 per year for people who work and earn less than $75,000. Families with children would receive a slightly larger refund, and caregivers and students would also get this tax cut.”
This policy gets a resounding 72% support overall, with near unanimous support among Clinton voters and majority support among Trump voters. Support is consistently strong across demographic groups, with no group falling below 69% support. Digging deeper:
As with other policies we’ve polled, we see stronger support among younger voters, with 15 points higher net support (support minus opposition) among voters under 45 compared to those aged 45+.
People of color show 14 points higher net support than white voters, with particularly strong support among Black respondents.
There is strong support among moderates (+65 net support) and among those who are not registered to vote (+57 net support), suggesting that Democrats could walk and chew gum at the same time - winning over persuadable voters while engaging with non-voters who might be interested in some new policies.
While many policies face a geographic penalty, where low support in rural areas lead to an unfavorable distribution of support throughout the states, that’s not a problem for expanding the EITC. Using a method called multilevel regression and poststratification, Data for Progress found that net support for EITC expansion is positive in every state, with relatively small levels of state-to-state variability.
| State | Support | Oppose | Net Support |
|---|---|---|---|
| AK | 68% (45 strong) | 22% (13 strong) | +46 |
| AL | 73% (47 strong) | 18% (9 strong) | +55 |
| AR | 73% (45 strong) | 18% (9 strong) | +55 |
| AZ | 69% (45 strong) | 22% (12 strong) | +48 |
| CA | 73% (44 strong) | 18% (10 strong) | +55 |
| CO | 71% (46 strong) | 20% (10 strong) | +51 |
| CT | 73% (44 strong) | 17% (9 strong) | +56 |
| DC | 72% (47 strong) | 21% (10 strong) | +51 |
| DE | 73% (47 strong) | 20% (10 strong) | +54 |
| FL | 72% (46 strong) | 20% (10 strong) | +52 |
| GA | 74% (47 strong) | 18% (9 strong) | +56 |
| HI | 70% (45 strong) | 23% (13 strong) | +47 |
| IA | 71% (45 strong) | 20% (10 strong) | +51 |
| ID | 71% (45 strong) | 18% (9 strong) | +53 |
| IL | 73% (46 strong) | 18% (8 strong) | +55 |
| IN | 72% (46 strong) | 18% (8 strong) | +55 |
| KS | 72% (46 strong) | 19% (10 strong) | +52 |
| KY | 73% (45 strong) | 18% (9 strong) | +56 |
| LA | 73% (47 strong) | 17% (8 strong) | +56 |
| MA | 74% (47 strong) | 18% (9 strong) | +55 |
| MD | 76% (47 strong) | 18% (8 strong) | +58 |
| ME | 72% (47 strong) | 18% (9 strong) | +54 |
| MI | 72% (46 strong) | 19% (9 strong) | +53 |
| MN | 71% (44 strong) | 21% (11 strong) | +50 |
| MO | 70% (44 strong) | 21% (11 strong) | +49 |
| MS | 73% (47 strong) | 18% (9 strong) | +54 |
| MT | 71% (45 strong) | 19% (10 strong) | +52 |
| NC | 75% (47 strong) | 17% (8 strong) | +58 |
| ND | 70% (45 strong) | 20% (10 strong) | +50 |
| NE | 72% (45 strong) | 18% (9 strong) | +54 |
| NH | 71% (47 strong) | 20% (10 strong) | +51 |
| NJ | 75% (46 strong) | 16% (8 strong) | +59 |
| NM | 70% (46 strong) | 21% (11 strong) | +49 |
| NV | 70% (46 strong) | 21% (11 strong) | +49 |
| NY | 75% (45 strong) | 15% (7 strong) | +60 |
| OH | 71% (45 strong) | 20% (11 strong) | +50 |
| OK | 74% (46 strong) | 18% (9 strong) | +56 |
| OR | 73% (46 strong) | 18% (9 strong) | +55 |
| PA | 72% (47 strong) | 18% (9 strong) | +53 |
| RI | 72% (46 strong) | 18% (9 strong) | +54 |
| SC | 74% (47 strong) | 18% (9 strong) | +56 |
| SD | 70% (46 strong) | 21% (10 strong) | +50 |
| TN | 73% (47 strong) | 18% (9 strong) | +54 |
| TX | 72% (46 strong) | 19% (10 strong) | +53 |
| UT | 71% (45 strong) | 20% (10 strong) | +51 |
| VA | 74% (46 strong) | 19% (10 strong) | +54 |
| VT | 72% (47 strong) | 20% (10 strong) | +52 |
| WA | 69% (45 strong) | 23% (13 strong) | +47 |
| WI | 73% (46 strong) | 19% (9 strong) | +54 |
| WV | 73% (45 strong) | 17% (8 strong) | +56 |
| WY | 70% (45 strong) | 19% (10 strong) | +51 |
Note: Statistical uncertainty makes it impossible to say much with confidence about support being higher or lower in one state than another--the main point is that support is high across the board.
Bipartisan support for expansion to caregivers and students
In addition, last July Data for Progress polled each constituent part of the policy separately, that is, both the expansion of the tax cut and the expansion of refunds to benefit caregivers and students. We found substantial support for both proposals. We asked, “Generally, students and caregivers don’t qualify for many tax credits that are reserved for those who work. Would you support or oppose classifying students and caregivers as workers in order to give them access to these tax credits?”
While some might fear that expansion to caregivers and students would be politically risky, we measured broad support including a majority of Republicans, two-to-one support among Independents, and overwhelming support among Democrats.

Perhaps the biggest takeaway from these results is that despite decades of racially charged rhetoric demonizing welfare recipients, the public is quite supportive of giving assistance to some people who are not employed according to the official definition. It’s long past time for Democrats to address the fact that students and caregivers slip through the cracks in employment-based assistance programs.
As above, we used multilevel regression and poststratification to assess the support for the expanded definition of work in each state.
| State | Support | Oppose | Net Support |
|---|---|---|---|
| AK | 56% (27 strong) | 17% (10 strong) | 39 |
| AL | 52% (26 strong) | 20% (11 strong) | 31 |
| AR | 53% (26 strong) | 23% (12 strong) | 30 |
| AZ | 55% (27 strong) | 19% (12 strong) | 36 |
| CA | 53% (28 strong) | 23% (13 strong) | 31 |
| CO | 55% (28 strong) | 18% (10 strong) | 37 |
| CT | 54% (27 strong) | 22% (13 strong) | 32 |
| DC | 42% (29 strong) | 18% (4 strong) | 25 |
| DE | 49% (27 strong) | 22% (11 strong) | 27 |
| FL | 51% (28 strong) | 23% (13 strong) | 28 |
| GA | 51% (27 strong) | 21% (10 strong) | 30 |
| HI | 53% (30 strong) | 18% (9 strong) | 35 |
| IA | 56% (29 strong) | 18% (9 strong) | 38 |
| ID | 59% (27 strong) | 19% (12 strong) | 40 |
| IL | 54% (30 strong) | 18% (8 strong) | 37 |
| IN | 56% (28 strong) | 16% (8 strong) | 40 |
| KS | 58% (28 strong) | 18% (10 strong) | 40 |
| KY | 52% (25 strong) | 23% (13 strong) | 29 |
| LA | 52% (26 strong) | 20% (10 strong) | 32 |
| MA | 54% (29 strong) | 19% (9 strong) | 35 |
| MD | 49% (28 strong) | 23% (10 strong) | 27 |
| ME | 56% (28 strong) | 17% (8 strong) | 39 |
| MI | 55% (29 strong) | 16% (9 strong) | 38 |
| MN | 54% (28 strong) | 21% (12 strong) | 33 |
| MO | 57% (28 strong) | 19% (11 strong) | 38 |
| MS | 50% (26 strong) | 19% (10 strong) | 31 |
| MT | 58% (27 strong) | 20% (12 strong) | 38 |
| NC | 49% (26 strong) | 24% (12 strong) | 26 |
| ND | 58% (27 strong) | 18% (11 strong) | 40 |
| NE | 57% (28 strong) | 19% (11 strong) | 38 |
| NH | 56% (29 strong) | 17% (9 strong) | 39 |
| NJ | 55% (28 strong) | 20% (11 strong) | 35 |
| NM | 53% (27 strong) | 16% (9 strong) | 36 |
| NV | 54% (28 strong) | 15% (8 strong) | 39 |
| NY | 54% (27 strong) | 20% (11 strong) | 33 |
| OH | 55% (28 strong) | 16% (8 strong) | 39 |
| OK | 53% (25 strong) | 23% (14 strong) | 29 |
| OR | 56% (29 strong) | 20% (11 strong) | 36 |
| PA | 57% (29 strong) | 15% (7 strong) | 42 |
| RI | 56% (29 strong) | 17% (9 strong) | 39 |
| SC | 51% (26 strong) | 21% (11 strong) | 30 |
| SD | 57% (28 strong) | 18% (10 strong) | 39 |
| TN | 52% (26 strong) | 21% (12 strong) | 31 |
| TX | 49% (26 strong) | 21% (11 strong) | 28 |
| UT | 57% (26 strong) | 20% (13 strong) | 36 |
| VA | 50% (27 strong) | 24% (12 strong) | 26 |
| VT | 53% (29 strong) | 17% (7 strong) | 37 |
| WA | 55% (29 strong) | 17% (8 strong) | 38 |
| WI | 54% (28 strong) | 20% (12 strong) | 34 |
| WV | 53% (24 strong) | 24% (14 strong) | 29 |
| WY | 59% (25 strong) | 19% (12 strong) | 41 |
Expanding the EITC is a practical and feasible improvement to anti-poverty programs in the US, and should be debated along with complementary and alternative proposals such as student allowances and government funded training and payments to people engaged in unpaid care work.